Who to mail
Is it worth mailing this donor at all?
Use the model (tested on one organisation so far). We skipped 9,920 of 28,624 letters and still raised $1,393 more. On a real donor file, mailing only the donors the model expects to be worth the postage beats mailing everyone, in dollars raised and in letters saved. Both files below come from one charity's 1997 mailing.
We pretended it was 1 June 1997 and asked: for each donor, is a $0.68 mailing worth sending, or should we skip it?
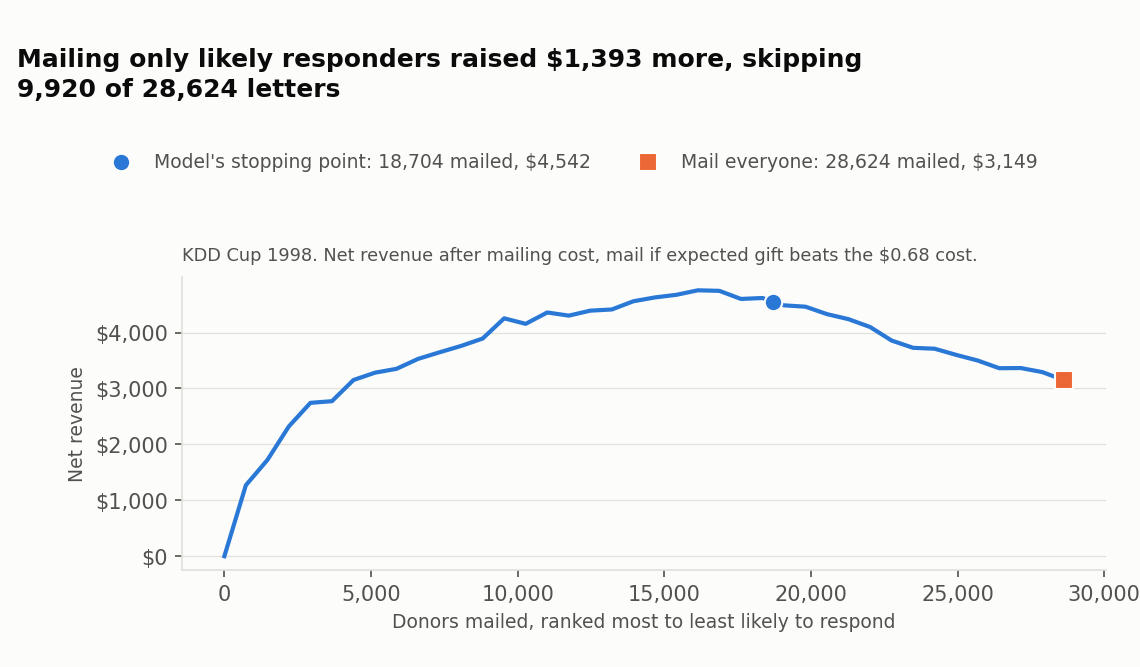
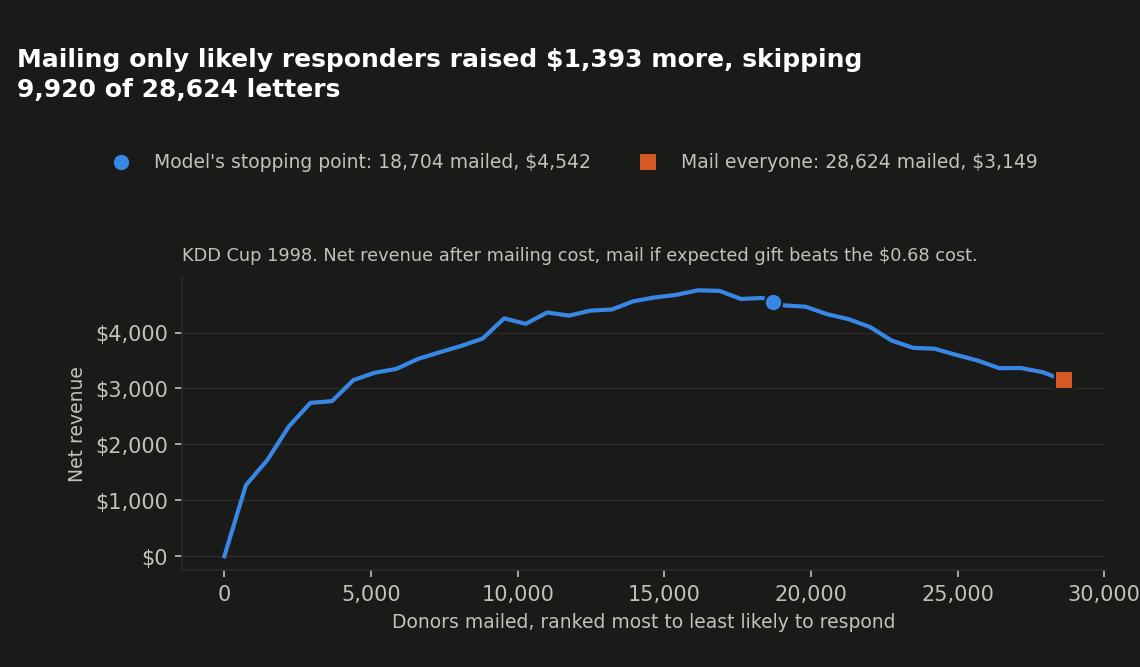
The chart ranks the 28,624 donors held out for this test from most to least likely to respond, and tracks net revenue as you mail further down that list. The model's own stopping point, mailing 18,704 of them, is marked: past that point, the next donor's expected gift no longer covers the $0.68 mailing cost, so mailing further loses money. That stopping point brings in $4,542 after costs, against $3,149 for mailing everyone.
Beats mailing everyone. Skipping the donors least likely to respond raised more money net, not less, even though fewer pieces went out. The curve also answers "what if our mailing costs more (or less) than $0.68?": a higher cost per piece shifts the stopping point left, without needing a new chart.
The same fit at four costs per letter. The cost only moves where the list stops; the models do not change. The range shows how far the difference moves when the held-out donors are resampled.
| Cost per letter | Letters sent | Raised after costs | Mailing everyone | Difference (range) |
|---|---|---|---|---|
| $0.50 | 25,982 of 28,624 | $8,107 | $8,301 | -$194 (-$444 to +$29) |
| $0.68 | 18,704 of 28,624 | $4,542 | $3,149 | +$1,393 (+$875 to +$1,841) |
| $1.00 | 5,226 of 28,624 | $1,630 | -$6,011 | +$7,640 (+$6,590 to +$8,592) |
| $2.00 | 466 of 28,624 | $433 | -$34,635 | +$35,068 (+$33,789 to +$36,256) |
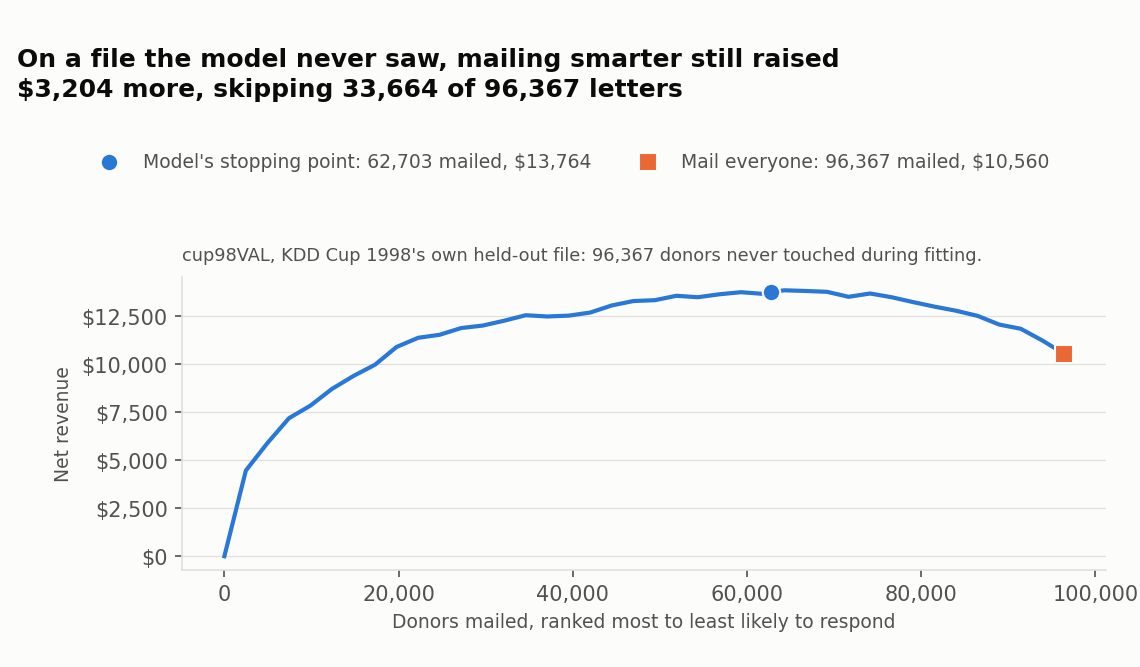
The KDD Cup 1998 tab scores a random 30% slice of the same file the model was fit on. KDD Cup
1998 also released a second, entirely separate file for exactly this purpose: cup98VAL, 96,367
more donors, with its answer key (valtargt) withheld until after the original competition and
never touched during fitting or the 55/15/30 split. Scored on that file with the same $0.68
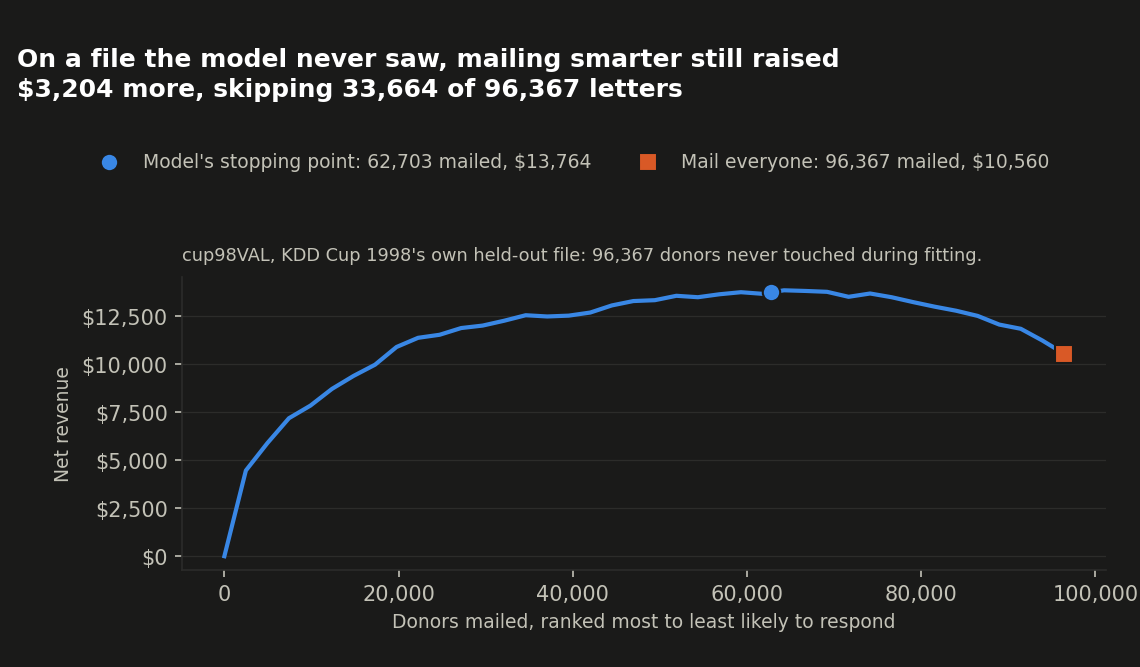
rule: mailing the 62,703 of 96,367 donors the model expected to be worth it brought in $13,764
after costs, against $10,560 for mailing everyone. Same shape as the first chart, on a file the
model has never seen in any capacity.
The same fit at four costs per letter:
| Cost per letter | Letters sent | Raised after costs | Mailing everyone | Difference (range) |
|---|---|---|---|---|
| $0.50 | 87,424 of 96,367 | $28,034 | $27,906 | +$128 (-$265 to +$533) |
| $0.68 | 62,703 of 96,367 | $13,764 | $10,560 | +$3,204 (+$2,220 to +$4,188) |
| $1.00 | 17,123 of 96,367 | $4,406 | -$20,277 | +$24,683 (+$22,809 to +$26,640) |
| $2.00 | 1,517 of 96,367 | $1,828 | -$116,644 | +$118,473 (+$116,241 to +$120,932) |
What this means for your file
- Scaled to a file of 10,000 donors like the KDD Cup 1998 one, the model skips about 3,470 letters and still brings in about $490 more after costs than mailing everyone.
- Gifts in that file are small (a few dollars to a few hundred), so read the dollar figures as a direction, not a forecast for a major-gift program.
- The answer depends on your cost per piece: at a higher cost the model mails fewer donors.
Try it on your own donors
import numpy as np
from philanthropy.models import AskAmountRecommender, DonorPropensityModel

# Replace with your own file: one row per donor, whether they gave to the last
# mailing, and what they gave; random arrays here only show the API runs.
rng = np.random.default_rng(0)
X_train, X_new = rng.random((400, 4)), rng.random((100, 4))
responded = rng.integers(0, 2, 400)
amount = rng.gamma(2.0, 20.0, 400)

response = DonorPropensityModel(random_state=0).fit(X_train, responded)
gave = responded == 1
ask = AskAmountRecommender(random_state=0).fit(X_train[gave], amount[gave])
expected_gift = response.predict_proba(X_new)[:, 1] * ask.predict(X_new)
mail = expected_gift > 0.68  # your cost per piece
How we tested
Real file: KDD Cup 1998, a 1990s
direct-mail history, with a 55/15/30 split and the separate cup98VAL file as a second check.
Results on your own file, and at your own mailing cost, will differ.
Not testable on DonorsChoose, PSID or Karlan and List. None of these files records a per-contact mailing cost, so cost-aware selection has no cost side to weigh.
Numbers for analysts
"Mail if expected gift beats the cost" multiplies a response model's score by a suggested gift amount, so there is no single ranking to attribute to one feature list. The drivers below are for the response half of that decision only; see What will this donor give next? for the amount half's own drivers.
On this file the model looks at 17 things about each donor.
| What it knows | What that means |
|---|---|
| Giving history | how much and how often they have given in total |
| Recency | how recently they gave |
| Wealth & demographics | wealth screening and demographic data |
| Mailing history | how they have responded to past mailings |
This file has no engagement records, so it is not used here.
These matter most:
| What raises or lowers the score | |
|---|---|
| last gift amount | ▼ lowers the score |
| lifetime number of gifts | ▲ raises the score |
| number of gifts | ▲ raises the score |
| donor's age | ● depends |
| months since last gift | ▼ lowers the score |
For analysts
Columns: AGE, INCOME, WEALTH1, WEALTH2, NUMCHLD, RAMNTALL, NGIFTALL, LASTGIFT, AVGGIFT, MAXRAMNT, MINRAMNT, TIMELAG, HOMEOWNER, rfm_recency, rfm_frequency, rfm_monetary, rfm_tenure
| Column | Importance | Direction |
|---|---|---|
LASTGIFT |
0.026 | - |
NGIFTALL |
0.008 | + |
rfm_frequency |
0.007 | + |
AGE |
0.006 | mixed |
rfm_recency |
0.005 | - |
Method: permutation importance (roc_auc), partial-dependence sign for direction ("mixed" if it changes sign). Split: 55/15/30 stratified (train/validation/test). Git SHA: d857e8aac5ff4cdbb8c91450cec7583480c1d7af.
Results on your own file will differ.
On this file the model looks at 17 things about each donor.
| What it knows | What that means |
|---|---|
| Giving history | how much and how often they have given in total |
| Recency | how recently they gave |
| Wealth & demographics | wealth screening and demographic data |
| Mailing history | how they have responded to past mailings |
This file has no engagement records, so it is not used here.
These matter most:
| What raises or lowers the score | |
|---|---|
| last gift amount | ▼ lowers the score |
| lifetime number of gifts | ▲ raises the score |
| number of gifts | ▲ raises the score |
| donor's age | ● depends |
| months since last gift | ▼ lowers the score |
For analysts
Columns: AGE, INCOME, WEALTH1, WEALTH2, NUMCHLD, RAMNTALL, NGIFTALL, LASTGIFT, AVGGIFT, MAXRAMNT, MINRAMNT, TIMELAG, HOMEOWNER, rfm_recency, rfm_frequency, rfm_monetary, rfm_tenure
| Column | Importance | Direction |
|---|---|---|
LASTGIFT |
0.026 | - |
NGIFTALL |
0.008 | + |
rfm_frequency |
0.007 | + |
AGE |
0.006 | mixed |
rfm_recency |
0.005 | - |
Method: permutation importance (roc_auc), partial-dependence sign for direction ("mixed" if it changes sign). Split: 55/15/30 stratified (train/validation/test). Git SHA: d857e8aac5ff4cdbb8c91450cec7583480c1d7af.
Same response model and features as the KDD Cup 1998 tab; cup98VAL supplies new test donors on the same columns, not new columns.
Results on your own file will differ.