Results
Plain-language answers to one question: does each model actually help you pick better than the simple rule your shop already uses, or than picking at random? No statistics jargon here; everything is in donor counts. For the numbers behind these pages, see Model Validation & Benchmarks. New here? Start with How to read these pages; the files used are described in The datasets behind these pages.
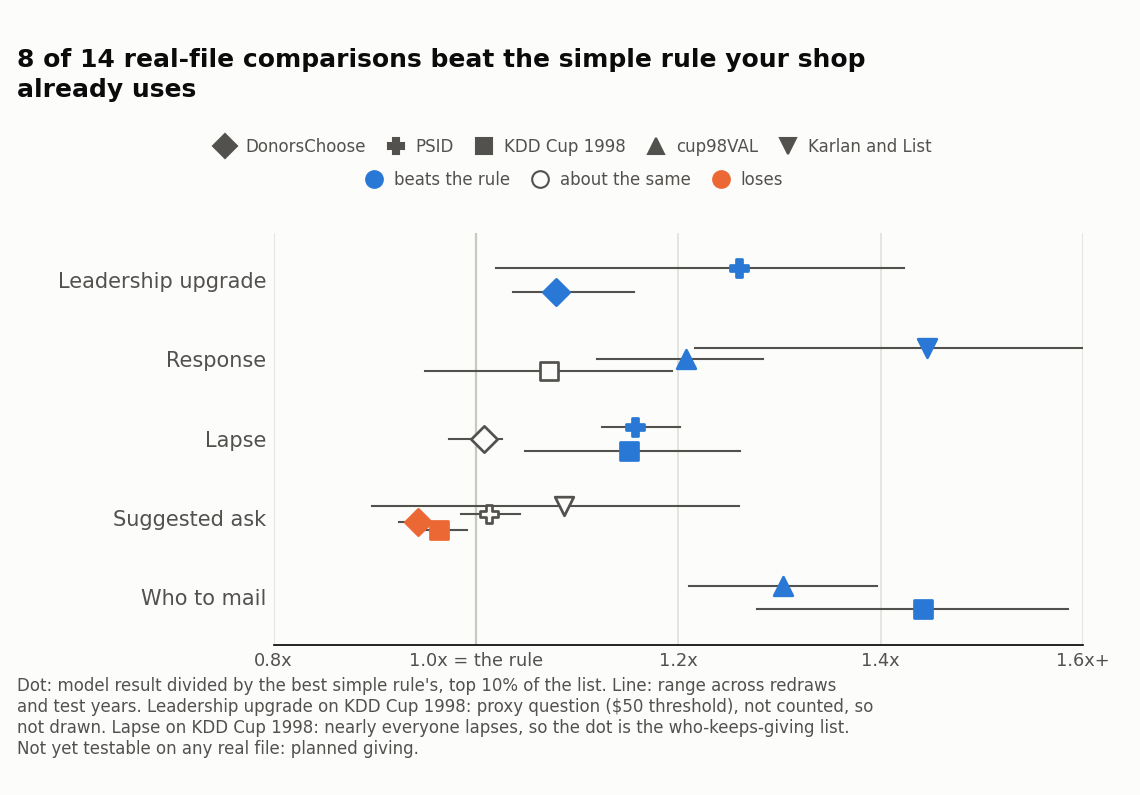
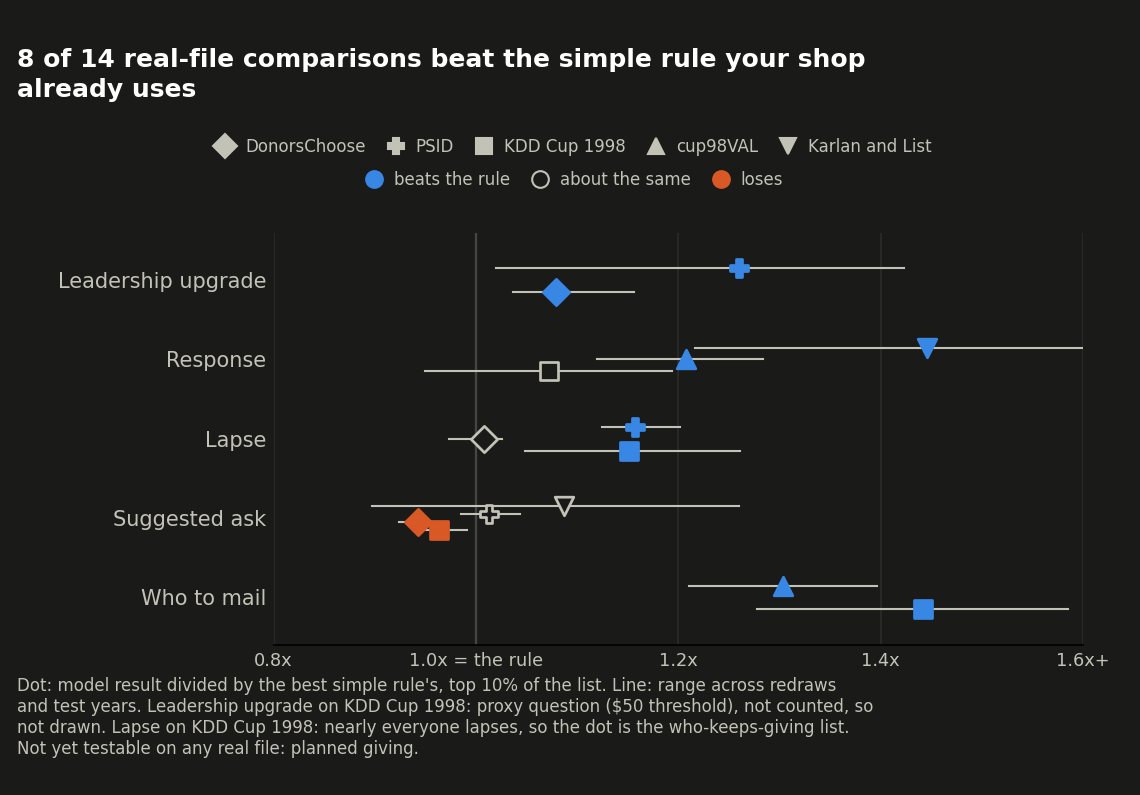
- "The rule" is whatever a fundraising shop already does without a model: rank by past giving, ask for what a donor gave last time, mail everyone. Every page compares the model against the best version of that rule it could find, not a strawman.
- "Random" is picking that many donors with no information at all, the floor any model or rule should beat.
- A filled dot right of the 1x line means the model earned its keep on that file; a filled dot left of it means the simple rule you already run for free did better, and a hollow dot means the two are too close to call. Losses are shown as often as wins on this page.
Each cell below is that model's result on that real file, in donors out of 100 among the top 10% it picks: beats the rule, about the same as the rule, or loses to the rule, or, where the file structurally cannot answer the question, can't test (reason). "not run" means that pairing was never run. A model only beats the rule when the whole range of its margin over the rule, across resamples or test years, lands on the model's side; if the range straddles zero the cell says about the same. The synthetic sample data is not in this table: it shows the code runs, not that the model helps.
Where nearly every donor lapses, a list of "who will lapse" has nothing useful to say, so the lapse cell reports the reverse list, who keeps giving, and how many times better than picking at random it is.
The bottom line follows one fixed rule, the same for every question; How to read these pages states it in full. Use the model needs wins on two independent sources (two organisations' files, or one file in every one of several test years) and no loss on a file that counts; wins from one organisation only read Use the model (tested on one organisation so far). A win next to a loss reads Can't tell yet. The KDD Cup 1998 upgrade cell is a $50 proxy for the $1,000 question, so it is shown but not counted. This table and the scoreboard above are generated from the same results file as every number on these pages.
| Model | Question it answers | KDD Cup 1998 | cup98VAL | DonorsChoose | PSID | Karlan and List | Bottom line |
|---|---|---|---|---|---|---|---|
| Leadership upgrade ($1,000+) | Which mid-level donors are about to become $1,000+ donors? | Proxy question ($50 threshold), not counted: loses 11 vs 12 of 100 | not run | Beats the rule: 9.0 vs 8.3 of 100 | Beats the rule: 41 vs 32 of 100 | can't test (one letter and no later giving) | Use the model |
| Response | Who is most likely to give again next year? | About the same as the rule: 8.9 vs 8.3 of 100, ahead in the top 1% or 5% | Beats the rule: 8.9 vs 7.4 of 100 | can't test (no mailing/appeal log) | can't test (no mailing/appeal log) | Beats the rule: 8.0 vs 5.5 of 100 | Use the model |
| Lapse | Which donors are about to stop giving? | Nearly everyone lapses here (95 of 100). Who keeps giving: beats the rule, 6.5 vs 5.6 of 100 (1.3x random) | not run | About the same as the rule: 81 vs 81 of 100 | Beats the rule: 55 vs 47 of 100 | can't test (one letter and no later giving) | Use the model |
| Suggested ask | What will this donor give next? | Loses to the rule: 65 vs 67 of 100 within 25% | not run | Loses to the rule: 30 vs 32 of 100 within 25% | About the same as the rule: 29 vs 28 of 100 within 25% | About the same as the rule: 45 vs 41 of 100 within 25% | Use the simple rule |
| Planned giving | Which donors look like bequest prospects? | can't test (no bequest-intent label) | not run | can't test (no bequest/estate-intent signal) | can't test (no bequest/estate-intent signal) | can't test (no bequest/estate-intent signal) | Can't tell yet |
| Who to mail | Is it worth mailing this donor at all? | Beats mailing everyone: $4,542 vs $3,149 net | Beats mailing everyone: $13,764 vs $10,560 net | can't test (no per-contact mailing cost) | can't test (no per-contact mailing cost) | can't test (no per-contact mailing cost) | Use the model (tested on one organisation so far) |
How we tested each one
For every model we picked a cutoff date, gave the model only the gifts recorded
up to that date, and then checked what the same donors actually did in the
following fiscal year. Every model is compared against a simple rule a
fundraising shop already uses without any model (rank by past giving, ask for
what they gave last time, mail everyone) and against picking at random. We ran
this on a synthetic sample donor panel we generate ourselves (five different
random draws, averaged, so one lucky sample can't flatter the numbers), and
three real public files: KDD Cup
1998, a 1990s
direct-mail history from a real nonprofit; DonorsChoose Open Data (ICPSR
37898, doi:10.3886/ICPSR37898.v1), a real giving history for an
education-crowdfunding platform (a random 10% sample of individual donors,
walk-forward by fiscal year); and the Panel Study of Income Dynamics (PSID),
a survey of US households every two years in which the household head reports
the household's total giving to all charities (survey waves 2015 to 2021
tested in turn, training on every earlier wave back to 2001). PSID data are
not redistributed here; to rerun those numbers, download your own extract from
the PSID Data Center. Every number on these pages is
produced by scripts/make_results_pages.py, committed alongside its output in
docs/assets/results/, so anyone can regenerate them.
Panel Study of Income Dynamics, public use dataset. Produced and distributed by the Survey Research Center, Institute for Social Research, University of Michigan, Ann Arbor, MI.