What will this donor give next?
Use the simple rule. On no real file does the model forecast the next gift reliably better
than a simple rule from the donor's own history: it loses on some files and is about the same on
the rest. The library gives you the usual rule, the larger of the donor's last gift and average
gift, stretched and rounded to a ladder, as one function call (suggest_ask, below).
This page tests a forecast: how much a donor will give next time. A suggested ask is a policy choice built on that forecast (how far to stretch, how to round), and no file here can say which ask works best, because the ask itself changes the gift.
Featured on a real donor file: KDD Cup 1998. We pretended it was 1 June 1997 and asked the model to suggest an amount for each donor who went on to give.
Of every 100 suggested amounts, 65 landed within 25% of what the donor actually gave. The best of the simple rules we compare against here, the higher of what they gave last time or their average gift, landed within 25% for 67 out of every 100.
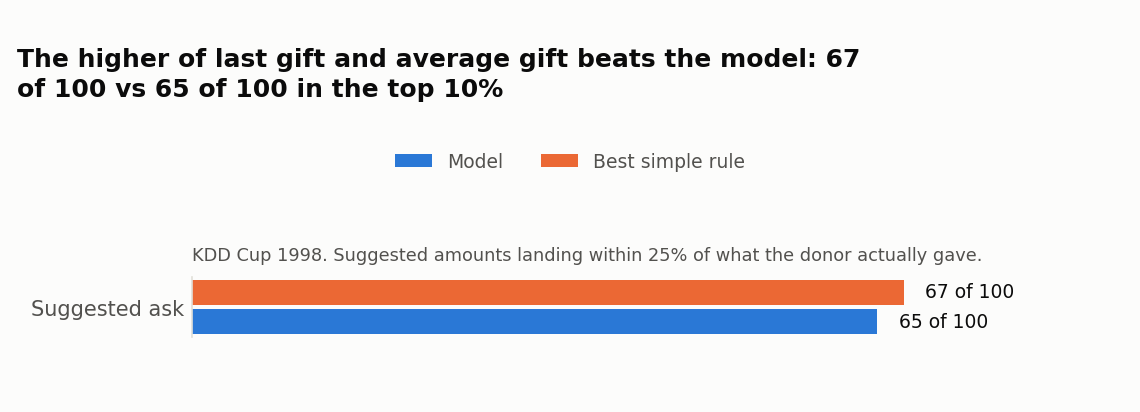
Does not beat the simple rule; use the rule instead. On this file, the simple rule is a better guess than the model's suggestion.
On DonorsChoose Open Data (ICPSR 37898, doi:10.3886/ICPSR37898.v1), we asked the model to suggest a donor's next fiscal-year total giving, given they give again (this file's gift dates are month-resolution, so a true next-single-gift amount is not well defined, matching the synthetic ask benchmark's own yearly target instead). A random 10% sample of citizen donors, fiscal years 2015-2018 tested in turn, training on every earlier year each time.
Of every 100 suggested amounts, 30 landed within 25% of what the donor actually gave the following year. The best of the 3 simple rules checked here (last period's total alone, the winner in all 4 test years) landed within 25% for 32 out of every 100.
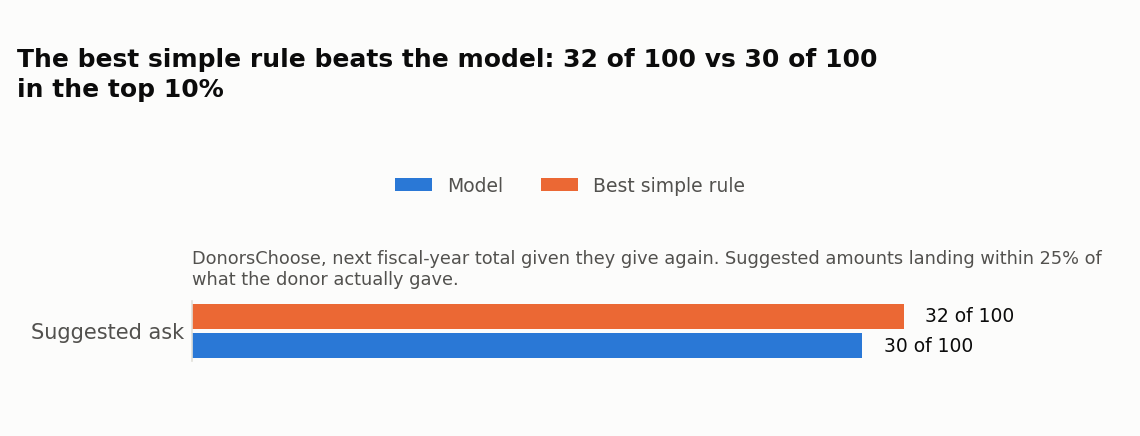
Does not beat the simple rule here either; use the rule instead. Adding this year's giving trend vs. last year's as its own feature made no real difference (30 out of 100 within 25% with it, versus 30 without).
Aggregates only; no donor-level figures are shown here.
The Panel Study of Income Dynamics (PSID) is a long-running survey of US households, interviewed every two years (one "wave" every two years). Each wave asks the household head how much the household gave to all charities over the past year, so these are self-reported household totals across every charity, not one organization's donor file. We asked the model to suggest a household's total giving in the next wave, given it gives again. We tested the 2015, 2017, 2019 and 2021 waves in turn, training on every earlier wave back to 2001 each time: between 2,360 and 2,881 households per test wave.
Of every 100 suggested amounts, 29 landed within 25% of what the household actually gave in the next wave. The best of the 3 simple rules checked here (last wave's total alone, the winner in all 4 test waves) landed within 25% for 28 out of every 100. The model was a little ahead in 2015 and 2017 and a shade behind in 2019 and 2021. On average it was off by $1,878, against $2,166 for the rule, and by less in every test wave.
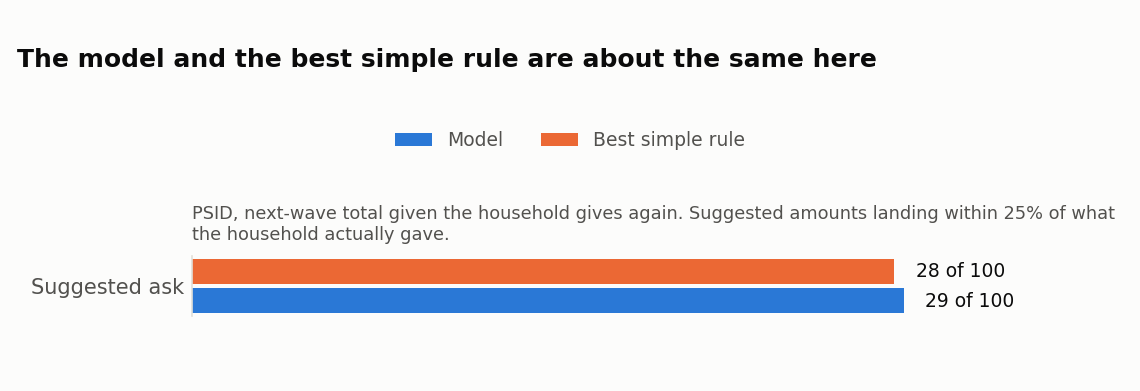
About the same as the rule here. It lands within 25% no more often than last wave's total does, though it is off by less on average. Adding the giving trend between waves as its own feature made no real difference (29 out of 100 within 25% with it, versus 29 without).
Only aggregates are shown here: no household IDs, no single-household examples. PSID data are not redistributed with this project; to rerun these numbers, download your own extract from the PSID Data Center.
Panel Study of Income Dynamics, public use dataset. Produced and distributed by the Survey Research Center, Institute for Social Research, University of Michigan, Ann Arbor, MI.
In the Karlan and List experiment, about 50,000 past donors to one US charity got one fundraising letter in 2005. We asked the model to predict how much each donor who gave would give, from what the charity knew before mailing. The file has no last or average gift, so the rules are the donor's largest past gift and the typical gift in the training donors. We tested on a held-out 30% of the donors: 310 who gave.
Of every 100 predicted amounts, 45 landed within 25% of the actual gift. The best rule, the donor's largest past gift, landed within 25% for 41 out of every 100. On average the model was off by $17, against $23 for the rule.
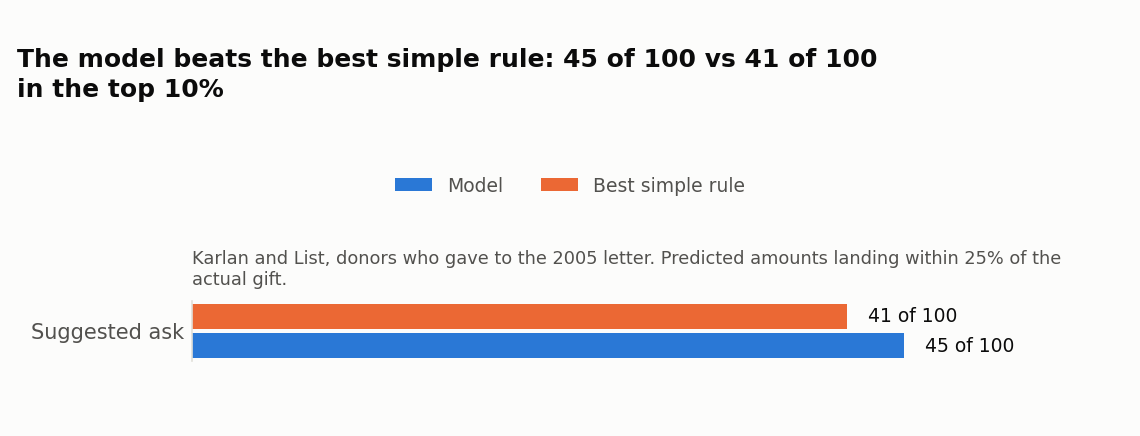
About the same as the rule here. It is not reliably closer within 25%, though it is off by less on average. This file has no last gift, which is the rule that is hardest to beat on the other files, so read this tab as a weaker test than those.
Aggregates only; no donor-level figures are shown here.
Karlan, D. and List, J. A. (2007), "Does Price Matter in Charitable Giving? Evidence from a Large-Scale Natural Field Experiment", American Economic Review 97(5): 1774-1793. Data from openICPSR 113224 (doi:10.3886/E113224V1), CC BY 4.0, copyright American Economic Association 2007.
Our sample (synthetic) donor panel is a code check only and is not counted in the verdict (about 23 in 100 within 25%, versus about 24 in 100 for the best of last gift, max(last gift, average gift), and the median training gift).
What this means for your file
- Of 10,000 suggested amounts on a file like KDD Cup 1998, the simple rule lands within 25% of the next gift for about 6,740 donors and the model for about 6,500.
- If you can only work the top of your list, the donors the model ranks highest bring in about as much as the ones the rule ranks highest (table below).
- Your file is not one of these. If you fit
AskAmountRecommender, let it check itself against the rule (below) and fall back to the rule when it does not win.
Each list is ranked by its own forecast (the rule's list by the rule's own amount). Of every $100 the donors gave next time, the top 10% of each ranking brought in:
| File | Model's top 10% | Rule's top 10% | |
|---|---|---|---|
| KDD Cup 1998 | $22 of every $100 | $22 | About the same |
| DonorsChoose | $64 of every $100 | $64 | About the same |
| PSID household survey | $43 of every $100 | $42 | Beats the rule, in every test wave |
| Karlan and List | $27 of every $100 | $28 | About the same |
This does not change the bottom line above. It does show one place the model adds something: on PSID its ranking finds the biggest givers slightly better than last wave's total does.
Try it on your own donors
from philanthropy.models import suggest_ask

suggest_ask(last_gift=[100, 40], avg_gift=[80, 55])  # array([125., 75.])
It takes the larger amount, adds 10% and rounds up to the next $25 (stretch= and round_to=
change both). If you do fit AskAmountRecommender, give it the columns for last and average gift
(last_gift_idx, avg_gift_idx): it then checks itself against the rule on a holdout and sets
beats_rule_, so you can fall back to the rule when it is False.
How we tested
Real files: KDD Cup 1998, DonorsChoose Open Data, the PSID household survey and the Karlan and List experiment. Each tab says what was predicted and on which donors. The model never beats the rule on any file, and is only about even with it on PSID and Karlan and List. Results on your own data will differ.
Numbers for analysts
On this file the model looks at 17 things about each donor.
| What it knows | What that means |
|---|---|
| Giving history | how much and how often they have given in total |
| Recency | how recently they gave |
| Wealth & demographics | wealth screening and demographic data |
| Mailing history | how they have responded to past mailings |
This file has no engagement records, so it is not used here.
These matter most:
| What raises or lowers the suggested ask | |
|---|---|
| last gift amount | ▲ raises the suggested ask |
| average gift amount | ▲ raises the suggested ask |
| number of gifts | ▼ lowers the suggested ask |
| lifetime giving | ▲ raises the suggested ask |
| largest gift ever | ▲ raises the suggested ask |
For analysts
Columns: AGE, INCOME, WEALTH1, WEALTH2, NUMCHLD, RAMNTALL, NGIFTALL, LASTGIFT, AVGGIFT, MAXRAMNT, MINRAMNT, TIMELAG, HOMEOWNER, rfm_recency, rfm_frequency, rfm_monetary, rfm_tenure
| Column | Importance | Direction |
|---|---|---|
LASTGIFT |
2.733 | + |
AVGGIFT |
0.795 | + |
rfm_frequency |
0.229 | - |
rfm_monetary |
0.213 | + |
MAXRAMNT |
0.133 | + |
Method: permutation importance (neg_mean_absolute_error), partial-dependence sign for direction ("mixed" if it changes sign). Split: 55/15/30 stratified (train/validation/test). Git SHA: d857e8aac5ff4cdbb8c91450cec7583480c1d7af.
Results on your own file will differ.
On this file the model looks at 3 things about each donor.
| What it knows | What that means |
|---|---|
| Giving history | how much and how often they have given in total |
| Recency | how recently they gave |
This file has no engagement and mailing history records, so they are not used here. Wealth & demographics is in this file, but this model is not given it here.
These matter most:
| What raises or lowers the suggested ask | |
|---|---|
| lifetime giving | ▲ raises the suggested ask |
| this year's gift | ● depends |
Only 2 features had a measurable effect; the rest are in the analyst note below.
For analysts
Columns: total, n, recent
| Column | Importance | Direction |
|---|---|---|
total |
25.692 (range 14.151 to 37.338) | + |
recent |
5.181 (range 1.101 to 9.047) | mixed |
n |
0.462 (range -2.434 to 3.683) | - |
Method: permutation importance (neg_mean_absolute_error), partial-dependence sign for direction ("mixed" if it changes sign). Split: walk-forward (train on fiscal years < T, test on T). Git SHA: d857e8aac5ff4cdbb8c91450cec7583480c1d7af.
Results on your own file will differ.
On this file the model looks at 8 things about each donor.
| What it knows | What that means |
|---|---|
| Giving history | how much and how often they have given in total |
| Recency | how recently they gave |
| Year-over-year change | whether this year's giving is up or down from last year |
This file has no engagement, wealth & demographics, and mailing history records, so they are not used here.
These matter most:
| What raises or lowers the suggested ask | |
|---|---|
| this year's giving | ▲ raises the suggested ask |
| largest gift this year | ▲ raises the suggested ask |
| number of gifts this year | ▲ raises the suggested ask |
| last year's giving | ▲ raises the suggested ask |
| giving two years ago | ▲ raises the suggested ask |
For analysts
Columns: fy_total, fy_total_prior1, fy_total_prior2, fy_trend, largest_gift, gift_count, consecutive_years_given, months_since_last_gift
| Column | Importance | Direction |
|---|---|---|
fy_total |
68.444 | + |
largest_gift |
14.647 | + |
gift_count |
13.859 | + |
fy_total_prior1 |
12.701 | + |
fy_total_prior2 |
1.903 | + |
Method: permutation importance (neg_mean_absolute_error), partial-dependence sign for direction ("mixed" if it changes sign). Split: walk-forward (subsample=0.1, seed=42, last fiscal-year fold). Git SHA: d857e8aac5ff4cdbb8c91450cec7583480c1d7af.
Results on your own file will differ.
On this file the model looks at 26 things about each household.
| What it knows | What that means |
|---|---|
| Giving history | how much and how often they have given in total |
| Recency | how recently they gave |
| Year-over-year change | whether this year's giving is up or down from last year |
| Engagement | events, volunteering and other non-gift contact |
| Wealth & demographics | self-reported household income and wealth (survey answers, not a wealth screen) |
This file has no mailing history records, so it is not used here.
These matter most:
| What raises or lowers the suggested ask | |
|---|---|
| this wave's giving | ▲ raises the suggested ask |
| last wave's giving | ● depends |
| giving to religious causes | ▲ raises the suggested ask |
| charitable deduction claimed on taxes | ● depends |
| largest single cause this wave | ▲ raises the suggested ask |
For analysts
Columns: total_giving, itemized_charitable_contrib_amount, family_income, wealth1, wealth2, head_volunteer_hours_annual, spouse_volunteer_hours_annual, household_volunteer_hours_regular, head_volunteer_hours_typical_week, spouse_volunteer_hours_typical_week, giving_checkpoint_other_2001, giving_combo, giving_community, giving_cultural, giving_education, giving_environment, giving_health, giving_international, giving_needy, giving_other, giving_religious, giving_youth, largest_giving_category, prior_wave_total, trend, waves_given_streak
| Column | Importance | Direction |
|---|---|---|
total_giving |
821.814 | + |
prior_wave_total |
317.692 | mixed |
giving_religious |
295.694 | + |
itemized_charitable_contrib_amount |
66.727 | mixed |
largest_giving_category |
57.953 | + |
Method: permutation importance (neg_mean_absolute_error), partial-dependence sign for direction ("mixed" if it changes sign). Split: walk-forward (seed=42, last wave fold). Git SHA: d857e8aac5ff4cdbb8c91450cec7583480c1d7af.
Results on your own file will differ.
On this file the model looks at 8 things about each donor.
| What it knows | What that means |
|---|---|
| Giving history | how much and how often they have given in total |
| Recency | how recently they gave |
| Wealth & demographics | gender, couple and the 2004 vote where the donor lives (no wealth screen) |
This file has no engagement and mailing history records, so they are not used here.
These matter most:
| What raises or lowers the suggested ask | |
|---|---|
| largest past gift | ▲ raises the suggested ask |
| number of past gifts | ▼ lowers the suggested ask |
| donor is a woman | ▼ lowers the suggested ask |
Only 3 features had a measurable effect; the rest are in the analyst note below.
For analysts
Columns: prior_gifts, highest_previous_amount, months_since_last_gift, years_since_first_gift, female, couple, red_state, red_county
| Column | Importance | Direction |
|---|---|---|
highest_previous_amount |
20.796 | + |
prior_gifts |
0.851 | - |
female |
0.021 | - |
couple |
-0.020 | - |
months_since_last_gift |
-0.056 | + |
Method: permutation importance (neg_mean_absolute_error), partial-dependence sign for direction ("mixed" if it changes sign). Split: 55/15/30 stratified (train/validation/test). Git SHA: d857e8aac5ff4cdbb8c91450cec7583480c1d7af.
Results on your own file will differ.