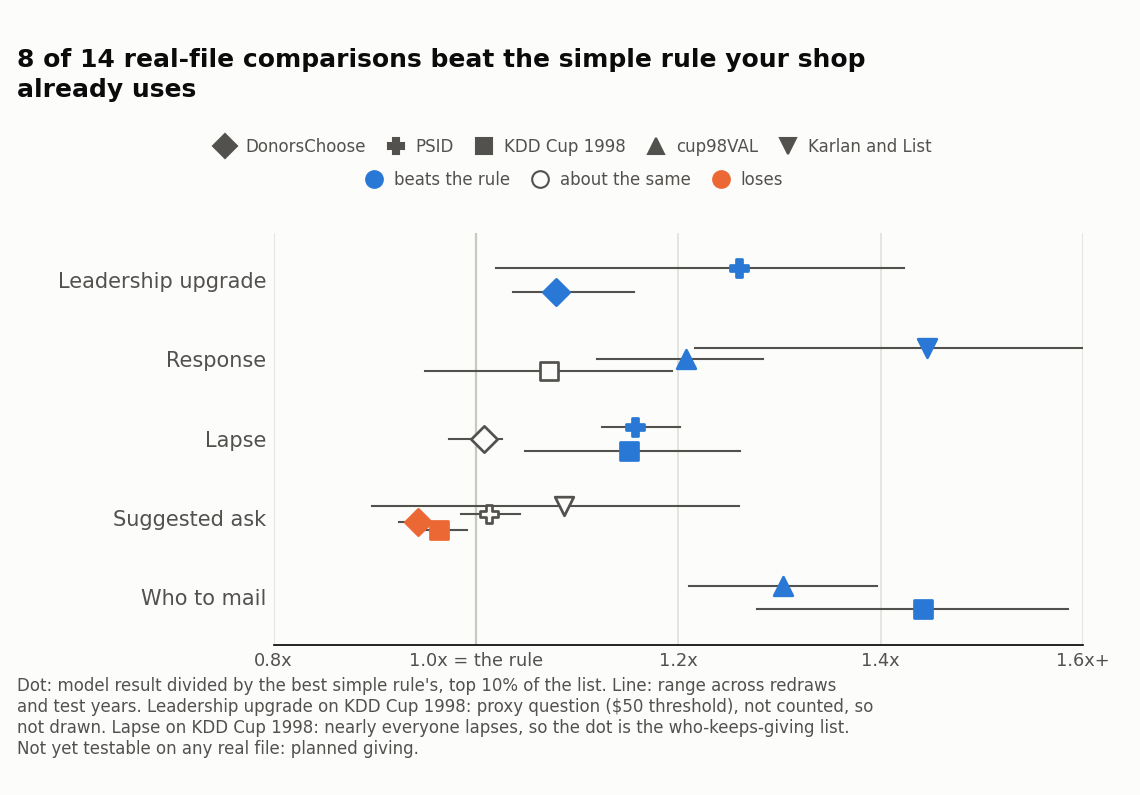
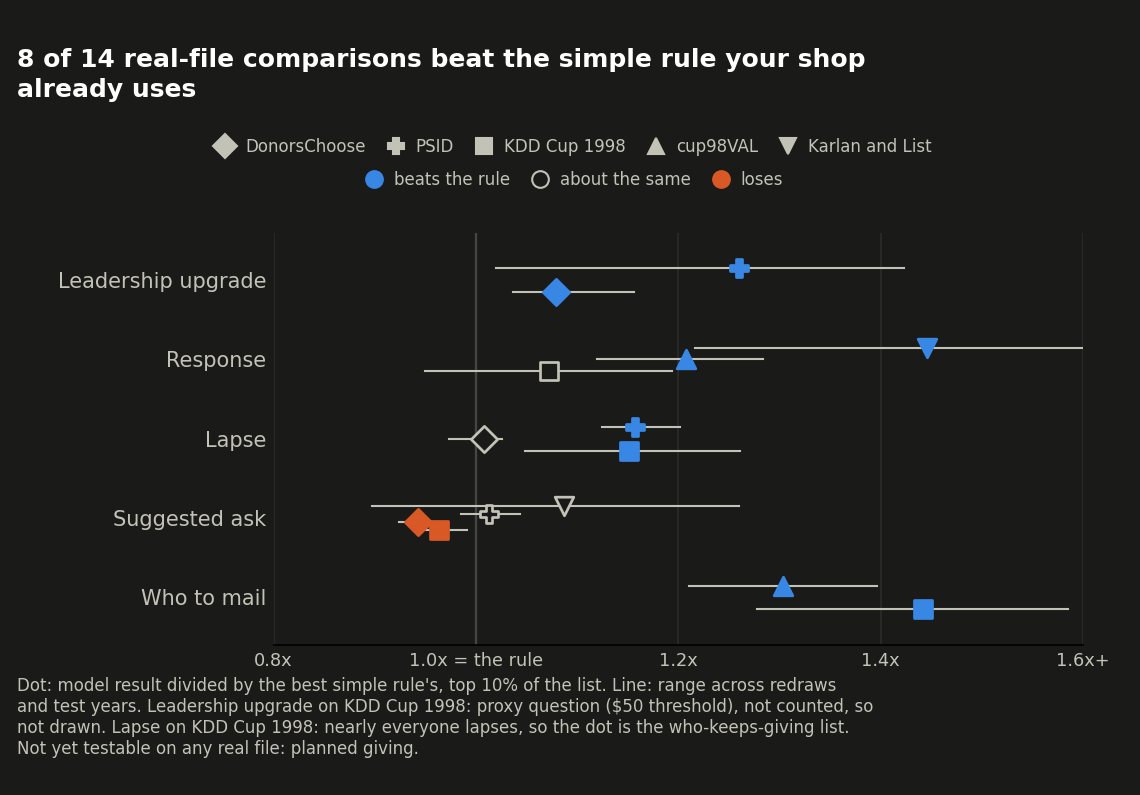
Find out whether a model beats the rule your shop already uses, before you pay for one.
PhilanthroPy scores your donors for major-gift propensity, lapse risk, and more, then checks the score against the rule your shop already runs without a model (rank by past giving, ask for what they gave last time), so you can see whether a model is worth adopting before you commit to one.
| # | Donor ID | Gave again? |
|---|---|---|
| 1 | D-04821 | Yes |
| 2 | D-01193 | Yes |
| 3 | D-07750 | Yes |
| 4 | D-02264 | No |
| 5 | D-05531 | Yes |
| 6 | D-09902 | No |
Six of the top picks from a held-out donor list, ranked by predict_affinity_score. See the Results for whether that beats the rule your shop already uses.
What is PhilanthroPy?
PhilanthroPy is a production-ready Python library that slots directly into sklearn.pipeline.Pipeline. It covers the full predictive workflow for nonprofit and academic medical center (AMC) fundraising, from raw CRM cleaning and wealth imputation to major-gift propensity scoring, lapse prediction, and planned-giving intent.
For developers
A ranked call list, scored honestly
import pandas as pd
from sklearn.metrics import roc_auc_score
from sklearn.model_selection import train_test_split

from philanthropy.datasets import generate_synthetic_donor_data
from philanthropy.models import DonorPropensityModel

df = generate_synthetic_donor_data(n_samples=2000, random_state=42)
X = df[["total_gift_amount", "years_active", "event_attendance_count"]].to_numpy()
y = df["is_major_donor"].to_numpy()

# Split BEFORE fitting. Scoring the rows you trained on tells you nothing.
X_train, X_test, y_train, y_test = train_test_split(
    X, y, test_size=0.25, stratify=y, random_state=42
)

model = DonorPropensityModel(n_estimators=200, random_state=0)
model.fit(X_train, y_train)

scores = model.predict_affinity_score(X_test)   # 0-100, not a raw probability
auc = roc_auc_score(y_test, model.predict_proba(X_test)[:, 1])

print(f"held-out ROC-AUC: {auc:.3f}")
print(pd.Series(scores).groupby(y_test).describe()[["count", "mean", "min", "max"]])
0.841held-out ROC-AUC, 500 donors the model never saw
Table view: the printed output and the quartiles behind the chart
What the snippet prints:
The full five-number summary the chart is drawn from:
| Group | n | Min | Q1 | Median | Q3 | Max |
|---|---|---|---|---|---|---|
| Non-major donors | 317 | 0.0 | 3.0 | 14.0 | 35.0 | 96.0 |
| Major donors | 183 | 1.0 | 38.5 | 62.0 | 83.25 | 100.0 |
Quick start
Get up and running in seconds:
Current release: 0.9.0
pip install philanthropy gives you 0.9.0. These docs are built from
main, which also carries the merged-but-unreleased 1.0.0 work.
See Deprecations for the handful of
differences that affect you today.
Motivation
Predictive fundraising in nonprofits and healthcare foundations is often dominated by proprietary, black-box vendor tools, or brittle, ad-hoc Python scripts that suffer from subtle temporal data leakage across fiscal-year boundaries. Machine-learning code built for the nuances of philanthropic giving was mostly non-existent.
PhilanthroPy exists to change that: a rigorous, open-source, scikit-learn-compatible foundation for donor analytics. It puts advanced fundraising data science within reach of any team, so nonprofits can use their own data to safely and effectively identify their best prospects, without relying entirely on expensive outside vendors.
Key features & capabilities
A comprehensive suite of tools, easy to understand and use:
Messy data cleaning. Standardises raw CRM exports (Salesforce NPSP, Raiser's Edge, Nonprofit Cloud), fixing dates and currency amounts without crashing.
CRMCleaner
Fiscal-calendar awareness. Nonprofits run on fiscal years (e.g. July–June). PhilanthroPy understands these boundaries natively, preventing future data from leaking into historical models.
FiscalYearTransformer
Smart wealth imputation. Third-party wealth vendors rarely match every record. This estimates missing wealth capacity (like real-estate value) from similar donors using K-nearest neighbours.
WealthScreeningImputerKNN
Grateful-patient featurization. For academic medical centers, translates clinical-encounter histories into major-gift signals while decoupling them from explicit patient identifiers (PHI). This reduces compliance risk but is not formal HIPAA de-identification. See Compliance Considerations.
GratefulPatientFeaturizer
Propensity & share of wallet. Estimators for capacity utilisation (what share of a donor's modelled wealth is estimated philanthropic capacity, not what share of their giving you receive) and the next best engagement step for a gift officer.
ShareOfWalletScorer
Multi-source uploads, one upgrade model. Maps and folds any number of tagged CRM/engagement exports (gifts, event attendance, volunteer hours, ...) into one donor table, then trains and scores who is likely to move from mid-level giving to your leadership threshold next fiscal year, all cut at an as_of date so nothing dated after it can leak in.
build_leadership_snapshots, score_leadership_prospects
Getting started
The quickest way to get familiar with PhilanthroPy is to dive into the Tutorials.
Explore the docs
Step-by-step, learning-oriented lessons for beginners.
Goal-oriented recipes for specific tasks.
Understanding-oriented concepts and architecture.
Information-oriented API docs.