Leadership upgrade ($1,000+)
Which donors giving $100 to $999 this fiscal year will give $1,000 or more next fiscal year?
Use the model. It beats the simple rule on the two real files that can ask the $1,000 question, PSID household survey data and DonorsChoose, in every test year on both. KDD Cup 1998's gifts are too small for $1,000, so its tab asks a $50 proxy question instead; the model loses there, and that tab is shown but not counted. Results on your own file will differ, so check it on your own donors before relying on it.
The Panel Study of Income Dynamics (PSID) is a long-running survey of US households, interviewed every two years (one "wave" every two years). Each wave asks the household head how much the household gave to all charities over the past year, broken down by cause. So these are self-reported household totals across every charity, not one organization's donor file. We took households that gave $100 to $999 in a wave and checked which of them reported $1,000 or more in the next wave. We tested the 2015, 2017, 2019 and 2021 waves in turn, training on every earlier wave back to 2001 each time: between 1,315 and 1,751 households per test wave, and about 16 in 100 of them crossed $1,000.
Of the model's top 10% of picks, 41 out of every 100 crossed $1,000 by the next wave. The best of the 3 simple rules checked here (this wave's total alone, the winner in all 4 test waves) found 32 out of every 100. The model was ahead at the top 10% in every test wave, though only barely in 2019 (37 vs 36). At the top 5% it found 45 against 35.
The top 1% looks even better for the model (48 in 100 against 23 for the rule), but that group is only 13 to 18 households per test wave, so treat it as a hint, not a measurement.
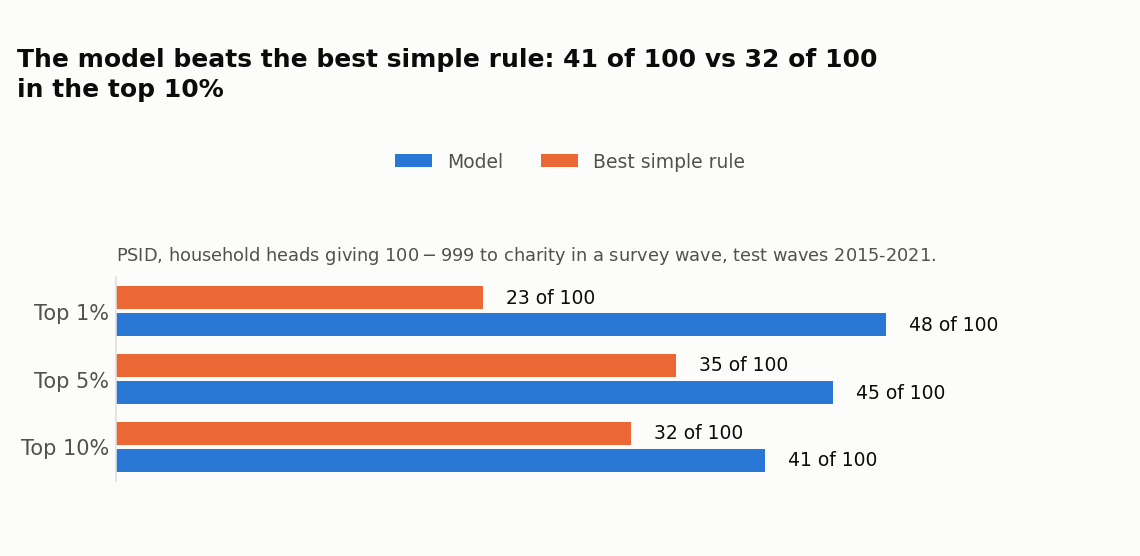
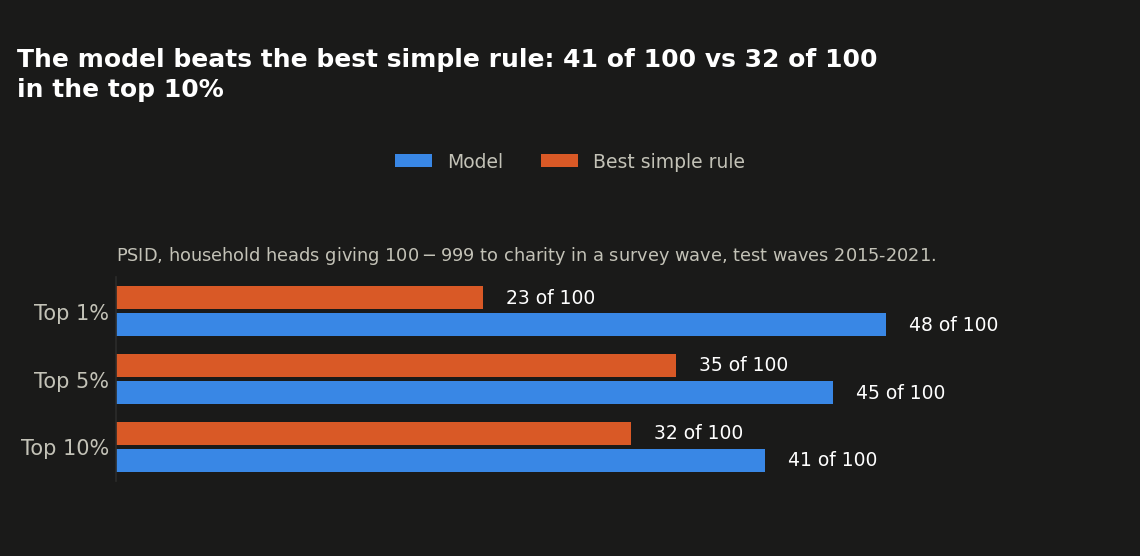
Beats the rule here, judged on the top 10% of the list.
Adding the giving trend between waves as its own feature moved the top 10% from 41 to 42 out of 100, too small to call a change. The top 1% moved from 48 to 62, but on 13 to 18 households per wave that is a few households either way, so it is not evidence of anything.
Only aggregates are shown here: no household IDs, no single-household examples. PSID data are not redistributed with this project; to rerun these numbers, download your own extract from the PSID Data Center.
Panel Study of Income Dynamics, public use dataset. Produced and distributed by the Survey Research Center, Institute for Social Research, University of Michigan, Ann Arbor, MI.
DonorsChoose Open Data (ICPSR 37898, doi:10.3886/ICPSR37898.v1) is a real giving history for an education-crowdfunding platform, far larger than KDD Cup 1998. We used a random 10% sample of individual ("citizen") donors (about 40,000 donor-year rows across the test years) and tested fiscal years 2015 through 2018 in turn, training on every earlier year each time.
Of the model's top 10% of picks, 9 out of every 100 crossed $1,000 the following fiscal year. The best of the 3 simple rules checked here (this year's total alone, the winner in all 4 test years) found 8 out of every 100. At the very top of the list the model is clearly ahead: its top 1% found 28 in 100 against 20 in 100 for the rule. Upgrading to $1,000+ is rare in this file: only about 1 in 100 donors in the test years did it at all.
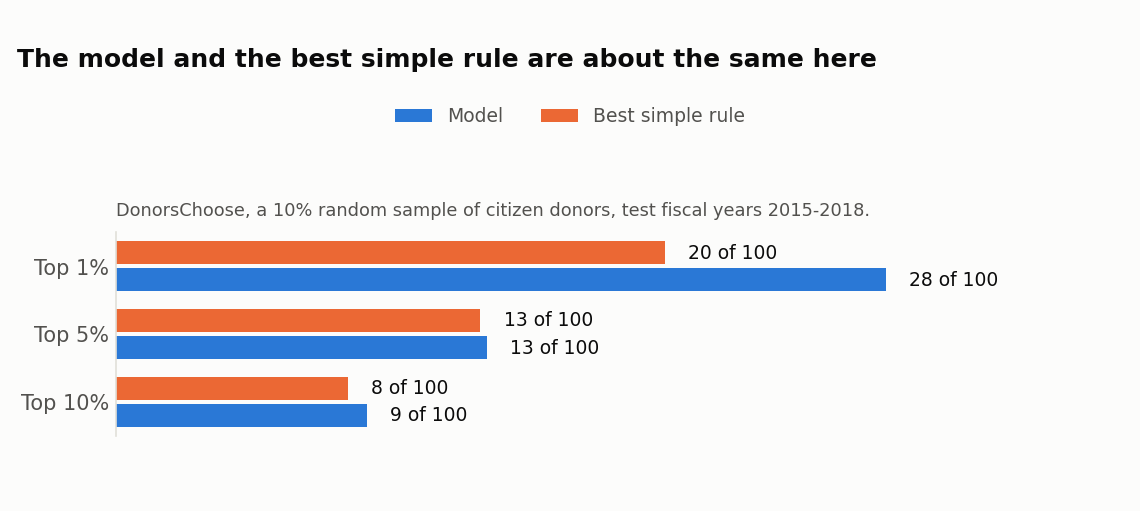
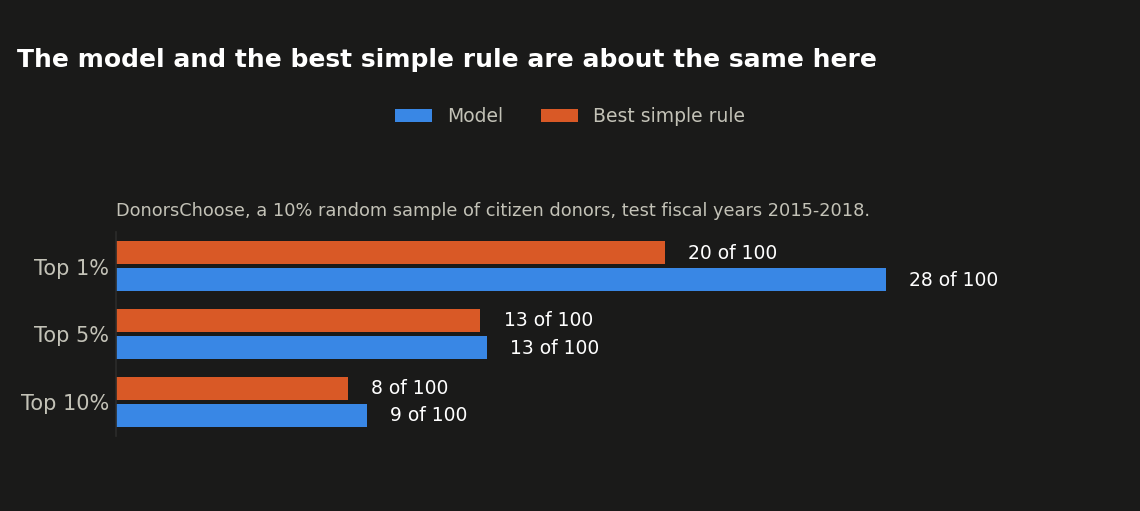
Beats the rule here: ahead in every test year, and furthest ahead at the very top of the list.
Adding this year's giving trend vs. last year's as its own feature made essentially no difference here either: the model's top 10% hit rate is 9 out of 100 with it, 9 without. The top 1% shifts from 28 to 25 out of 100, but that group is only about 100 donors per test year, so a 3-donor difference is too small to call a real change either way: this is a single fit on one file, with no seed range to check it against.
Never a donor ID or single-donor example here: every number above is an aggregate over the sampled donor population.
KDD98's gifts top out far lower than a major-gift program's, so the threshold is rescaled to
$50 (the 92nd percentile of per-donor giving in the file's two snapshot years, fiscal 1994 for
training and fiscal 1995 for the test, set with threshold="p92") instead of $1,000, and the
test is walk-forward by fiscal year rather than the sample data's random split (this file has
only one real fiscal-year transition to test on; see "How we tested" below).
Of the model's top 10% of picks, 11 out of every 100 crossed $50. The best rule (the largest single gift already in the eligible band) found 12 out of every 100. At the very top of the list the gap is bigger and goes the other way: the model's top 1% found 17 in 100 against 23 in 100 for the rule.
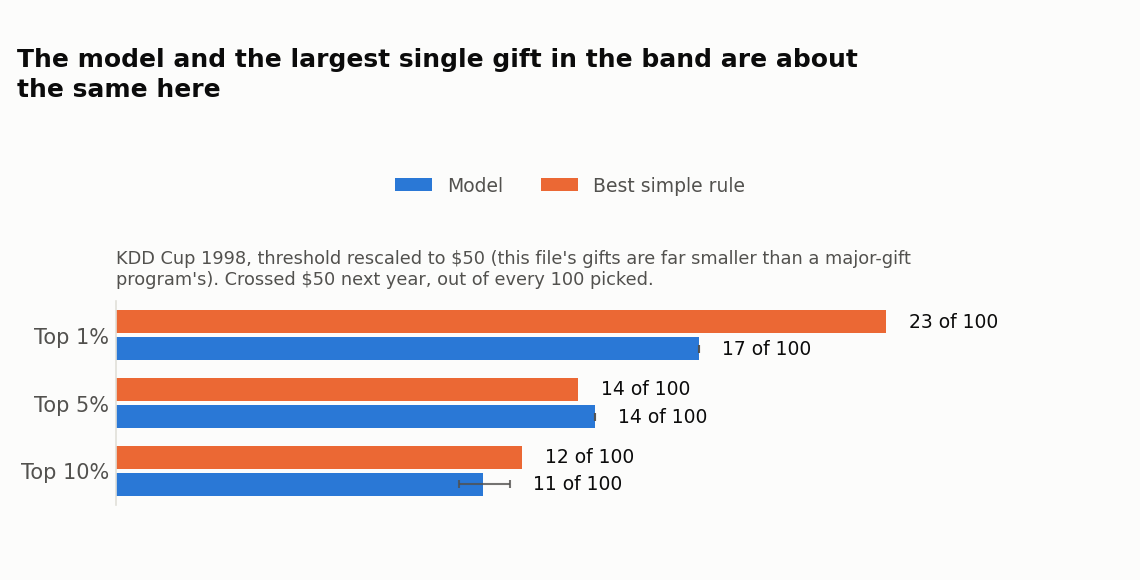
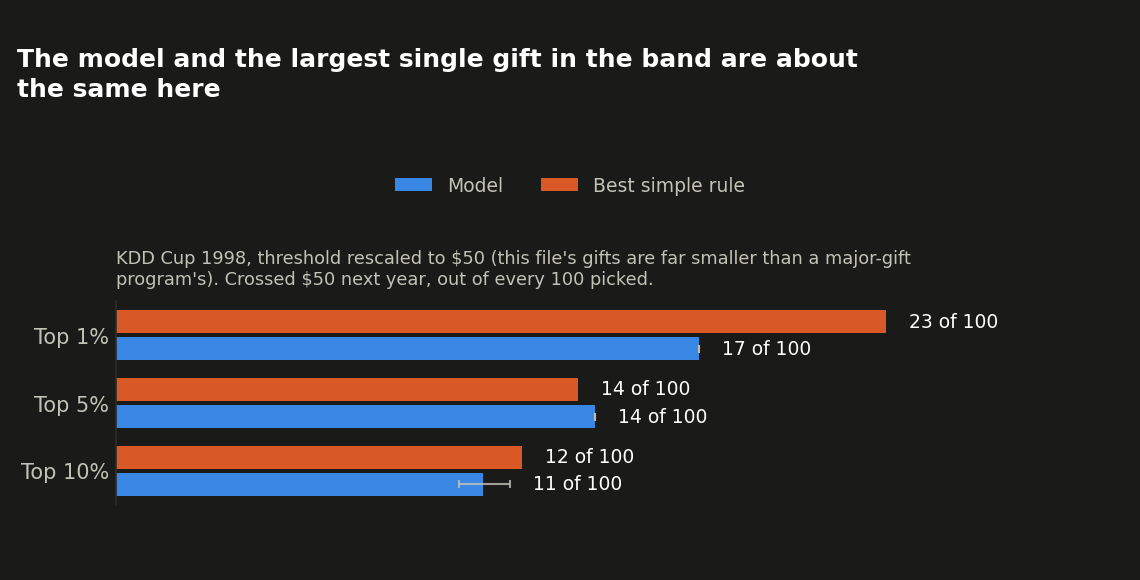
Loses here. On this file, at this threshold, ranking by the size of a donor's biggest eligible gift beats the model, especially for the very top of the list. This is a $50 proxy for the $1,000 question, so it is not counted in the bottom line.
Adding this year's giving trend vs. last year's as its own feature made no difference here at all: the model's top 1/5/10% hit rates (17, 14, and 11 out of 100) are identical with and without it, down to the last fraction of a percent. On this file the model gives those extra columns zero weight, not "no data to add": the columns are there, the fit just never uses them.
We pretended it was 30 June 2021: the model only saw gifts up to that date, then we checked what mid-level donors actually did in fiscal year 2022 (1 July 2021 to 30 June 2022), specifically which of them crossed $1,000 for the first time.
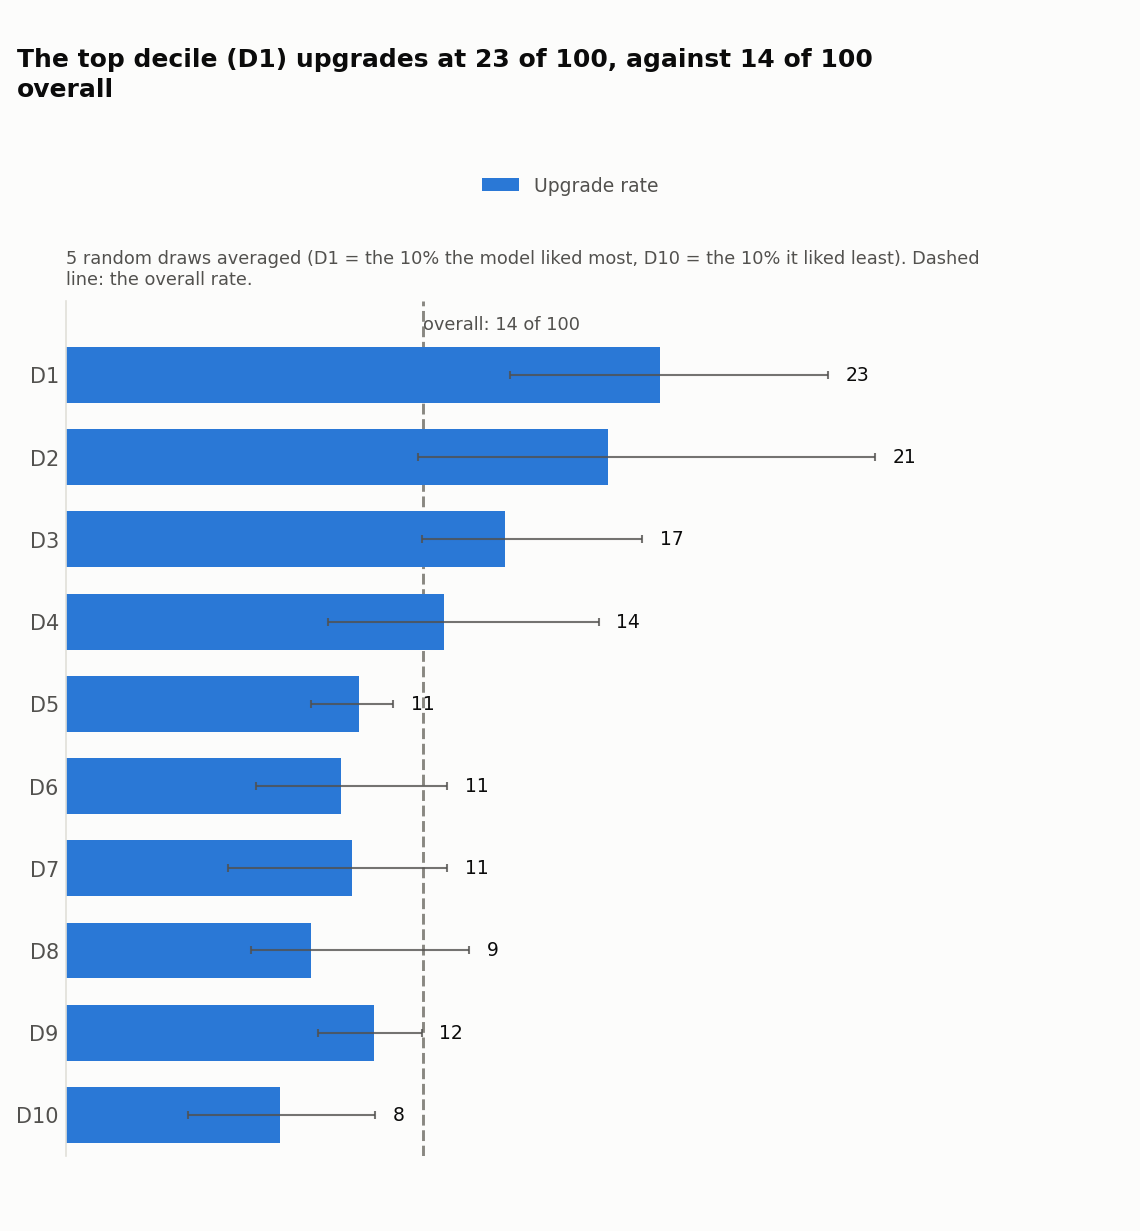
Of our top 10% of picks, 22 out of every 100 crossed $1,000. Ranking by this year's giving total alone found 18 out of every 100. Picking at random finds about 12 out of every 100.
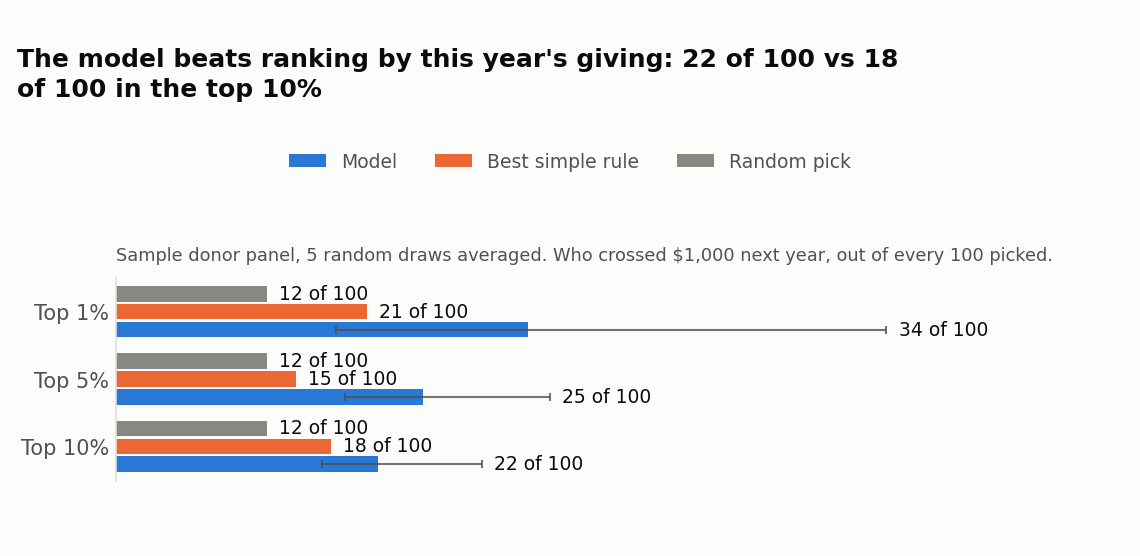
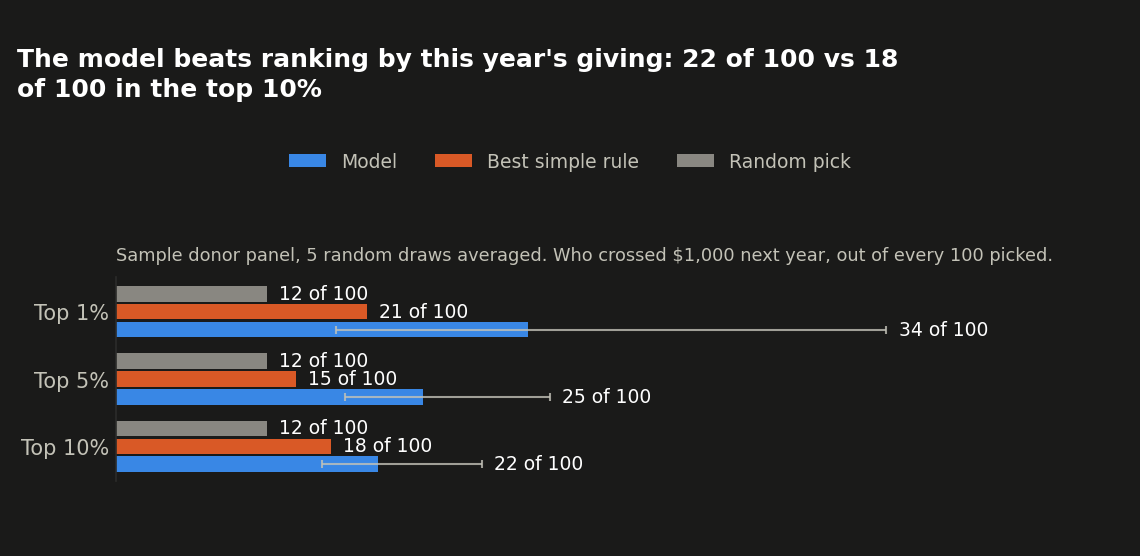
Code check only: sample data is not counted in the verdict.
Worked example.
Run score_leadership_prospects on a sample donor panel (make_donor_panel(random_state=42),
one of the five draws averaged above), cutting off at 30 June 2021 and checking fiscal year
2022. Out of 1,035 mid-level donors held out for validation, the model's top 104 picks (its
top 10%) included 21 who actually upgraded. Ranking those same 1,035 donors by this year's
total giving instead would also have found 21 at this particular draw, a tie. Picking 104
of them at random would find about 14.
Why this number is not the 22-vs-18 headline above. The chart above is the average of
five draws, scored with the benchmark's own feature set built specifically to compare against
the rule; this worked example runs the actual public score_leadership_prospects function
end to end on one of those same five draws (the first), which has its own feature set and
model settings and so gets its own answer. Both beat the naive "pick at random" floor; take
the five-draw average as the more reliable estimate of the gap, and this one seed as proof
the shipped function itself works, not a second measurement of the same number.
The chart below averages the same per-decile breakdown across all five draws (D1 = the 10% the model liked most, D10 = the 10% it liked least), with the range across draws shown as a line through each bar. The top decile clearly stands out; the groups below it decline toward the overall rate. Use the model to pick your top slice, not to rank the whole file:
What this means for your file
- On a list of 10,000 mid-level households like PSID's, the model's first 1,000 names include about 410 who reach $1,000 the next wave; ranking by this wave's giving finds about 320.
- On a file where upgrading is rare, like DonorsChoose, the gain is at the very top: the model's first 100 names out of 10,000 include about 28 upgraders, against about 20 for the rule.
- Your file is not one of these.
score_leadership_prospectsreports how its own list did on your most recent year, and how long a list is still worth working (recommended_list_size).
Try it on your own donors
$1,000 is the default leadership level; set your own with threshold= (a dollar amount, or
"p92" for a percentile of your own donors' giving) and band= in score_leadership_prospects
(or --threshold / --band on the command line).
from philanthropy.datasets import make_donor_panel
from philanthropy.models import score_leadership_prospects

# Replace with your own gift export: one row per gift, with donor_id, date
# and amount columns.
gifts = make_donor_panel(random_state=0)["gifts"]

scored, report = score_leadership_prospects(gifts, random_state=0)
scored.head(10)                          # today's best prospects, ranked
report["recommended_list_size"]          # how far down the list to work
How we tested
PSID and DonorsChoose are the two real files where this model beats the rule today. KDD Cup 1998, DonorsChoose and PSID are the three real files we can test the $1,000 upgrade question on (KDD98's gifts are too small to test the real $1,000 threshold, so the threshold on that tab is rescaled; DonorsChoose's and PSID's amounts are large enough to use $1,000 as-is). The Karlan and List experiment is one letter with no later giving, so it cannot test upgrading at all. Results on your own file, at your own dollar threshold, will differ from all four.
Numbers for analysts
Does the model carry over to a file it never saw?
We fit the upgrade model on DonorsChoose alone, using only columns that mean the same thing on any file whatever its dollar scale (this year's total over the largest gift, the largest gift over last year's total, gifts per year of the current streak, rank within the year, the streak itself, whether the donor gave in each of the last two years, and years since the first gift; no dollar amounts), then scored two files it never saw, each against that file's own simple rules.
On PSID, the model's top 10% of picks found 36 out of every 100 households crossing $1,000, against 32 for the best rule, ahead in every one of the 4 test waves. On KDD Cup 1998's $50 proxy question it found 5 out of every 100, against 12 for the best rule (the largest gift already in the band), so it does not carry over to that file: dollar-free columns learned on one charity's donors did not transfer to a mail-response file whose leadership level is 20 times smaller ($50 against $1,000). A model fit on one charity's donors is not a substitute for checking it on your own file. This check is reported here only and does not count toward the bottom line above.
On this file the model looks at 8 things about each donor.
| What it knows | What that means |
|---|---|
| Giving history | how much and how often they have given in total |
| Recency | how recently they gave |
| Year-over-year change | whether this year's giving is up or down from last year |
This file has no engagement and mailing history records, so they are not used here. Wealth & demographics is in this file, but this model is not given it here.
These matter most:
| What raises or lowers the score | |
|---|---|
| last year's giving | ▲ raises the score |
| consecutive years given | ▲ raises the score |
Only 2 features had a measurable effect; the rest are in the analyst note below.
For analysts
Columns: fy_total, fy_total_prior1, fy_total_prior2, fy_trend, largest_gift, gift_count, consecutive_years_given, months_since_last_gift
| Column | Importance | Direction |
|---|---|---|
fy_total_prior1 |
0.047 (range 0.023 to 0.075) | + |
fy_total |
0.028 (range -0.001 to 0.049) | + |
fy_total_prior2 |
0.018 (range -0.000 to 0.034) | mixed |
consecutive_years_given |
0.015 (range 0.003 to 0.031) | + |
fy_trend |
0.000 (range -0.007 to 0.011) | mixed |
Method: permutation importance (roc_auc), partial-dependence sign for direction ("mixed" if it changes sign). Split: walk-forward (FiscalYearGroupedSplitter, last split). Git SHA: d857e8aac5ff4cdbb8c91450cec7583480c1d7af.
Results on your own file will differ.
On this file the model looks at 8 things about each donor.
| What it knows | What that means |
|---|---|
| Giving history | how much and how often they have given in total |
| Recency | how recently they gave |
| Year-over-year change | whether this year's giving is up or down from last year |
This file has no engagement records, so it is not used here. Wealth & demographics and mailing history are in this file, but this model is not given them here.
These matter most:
| What raises or lowers the score | |
|---|---|
| largest gift this year | ▲ raises the score |
| this year's giving | ▲ raises the score |
| months since last gift | ▲ raises the score |
Only 3 features had a measurable effect; the rest are in the analyst note below.
For analysts
Columns: fy_total, fy_total_prior1, fy_total_prior2, fy_trend, largest_gift, gift_count, consecutive_years_given, months_since_last_gift
| Column | Importance | Direction |
|---|---|---|
largest_gift |
0.101 | + |
fy_total |
0.080 | + |
months_since_last_gift |
0.048 | + |
fy_total_prior1 |
0.000 | mixed |
fy_total_prior2 |
0.000 | mixed |
Method: permutation importance (roc_auc), partial-dependence sign for direction ("mixed" if it changes sign). Split: walk-forward by fiscal year (train FY1994, test FY1995). Git SHA: d857e8aac5ff4cdbb8c91450cec7583480c1d7af.
Results on your own file will differ.
On this file the model looks at 8 things about each donor.
| What it knows | What that means |
|---|---|
| Giving history | how much and how often they have given in total |
| Recency | how recently they gave |
| Year-over-year change | whether this year's giving is up or down from last year |
This file has no engagement, wealth & demographics, and mailing history records, so they are not used here.
These matter most:
| What raises or lowers the score | |
|---|---|
| this year's giving | ▲ raises the score |
| last year's giving | ▲ raises the score |
| months since last gift | ▼ lowers the score |
| giving trend, this year vs last | ▲ raises the score |
| largest gift this year | ▲ raises the score |
For analysts
Columns: fy_total, fy_total_prior1, fy_total_prior2, fy_trend, largest_gift, gift_count, consecutive_years_given, months_since_last_gift
| Column | Importance | Direction |
|---|---|---|
fy_total |
0.090 | + |
fy_total_prior1 |
0.021 | + |
months_since_last_gift |
0.013 | - |
fy_trend |
0.007 | + |
largest_gift |
0.005 | + |
Method: permutation importance (roc_auc), partial-dependence sign for direction ("mixed" if it changes sign). Split: walk-forward (subsample=0.1, seed=42, last fiscal-year fold). Git SHA: d857e8aac5ff4cdbb8c91450cec7583480c1d7af.
Results on your own file will differ.
On this file the model looks at 26 things about each household.
| What it knows | What that means |
|---|---|
| Giving history | how much and how often they have given in total |
| Recency | how recently they gave |
| Year-over-year change | whether this year's giving is up or down from last year |
| Engagement | events, volunteering and other non-gift contact |
| Wealth & demographics | self-reported household income and wealth (survey answers, not a wealth screen) |
This file has no mailing history records, so it is not used here.
These matter most:
| What raises or lowers the score | |
|---|---|
| last wave's giving | ● depends |
| this wave's giving | ▲ raises the score |
| giving to religious causes | ▲ raises the score |
| head's volunteer hours in a typical week | ▲ raises the score |
| household wealth, not counting home equity | ● depends |
For analysts
Columns: total_giving, itemized_charitable_contrib_amount, family_income, wealth1, wealth2, head_volunteer_hours_annual, spouse_volunteer_hours_annual, household_volunteer_hours_regular, head_volunteer_hours_typical_week, spouse_volunteer_hours_typical_week, giving_checkpoint_other_2001, giving_combo, giving_community, giving_cultural, giving_education, giving_environment, giving_health, giving_international, giving_needy, giving_other, giving_religious, giving_youth, largest_giving_category, prior_wave_total, trend, waves_given_streak
| Column | Importance | Direction |
|---|---|---|
prior_wave_total |
0.072 | mixed |
total_giving |
0.042 | + |
giving_religious |
0.013 | + |
head_volunteer_hours_typical_week |
0.004 | + |
wealth1 |
0.002 | mixed |
Method: permutation importance (roc_auc), partial-dependence sign for direction ("mixed" if it changes sign). Split: walk-forward (seed=42, last wave fold). Git SHA: d857e8aac5ff4cdbb8c91450cec7583480c1d7af.
Results on your own file will differ.