Lapse
Which donors are about to stop giving?
Use the model. It beats the simple rule at picking who will lapse on PSID household survey data, and is about the same as the rule on DonorsChoose. On KDD Cup 1998, where nearly every donor lapses, a lapse list has nothing useful to say, so use the reverse list there: who is most likely to keep giving, which beats the rule. DonorsChoose and PSID ask only about donors with at least two years (or waves) of giving.
The Panel Study of Income Dynamics (PSID) is a long-running survey of US households, interviewed every two years (one "wave" every two years). Each wave asks the household head how much the household gave to all charities over the past year, so these are self-reported household totals across every charity, not one organization's donor file. Here a household "lapsed" if it gave something in one wave and reported giving nothing in the next. As on DonorsChoose, only households with at least two waves of giving are asked. We tested the 2015, 2017, 2019 and 2021 waves in turn, training on every earlier wave back to 2001 each time: between 2,733 and 3,295 households per test wave. Unlike the donor files in the other tabs, lapsing is a minority outcome here: about 23 out of every 100 households lapsed.
Of the model's top 10% of picks, 55 out of every 100 lapsed. The best simple rule (the smallest giving this wave first, the best of the 3 rules checked here in all 4 test waves) found 47 out of every 100. The model was ahead in every test wave. At the top 1% it found 69 against 49.
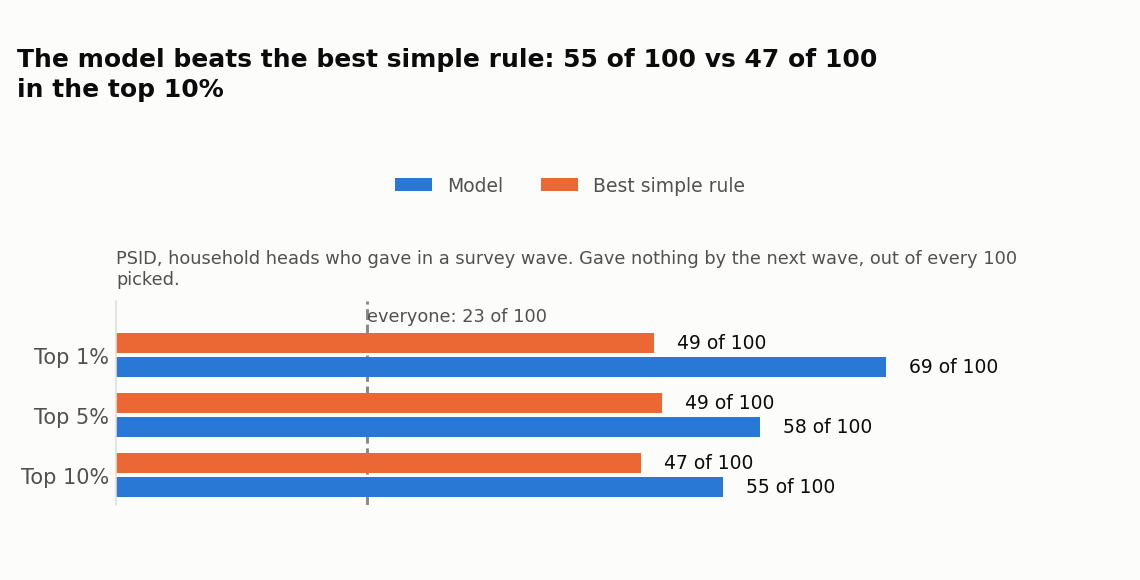
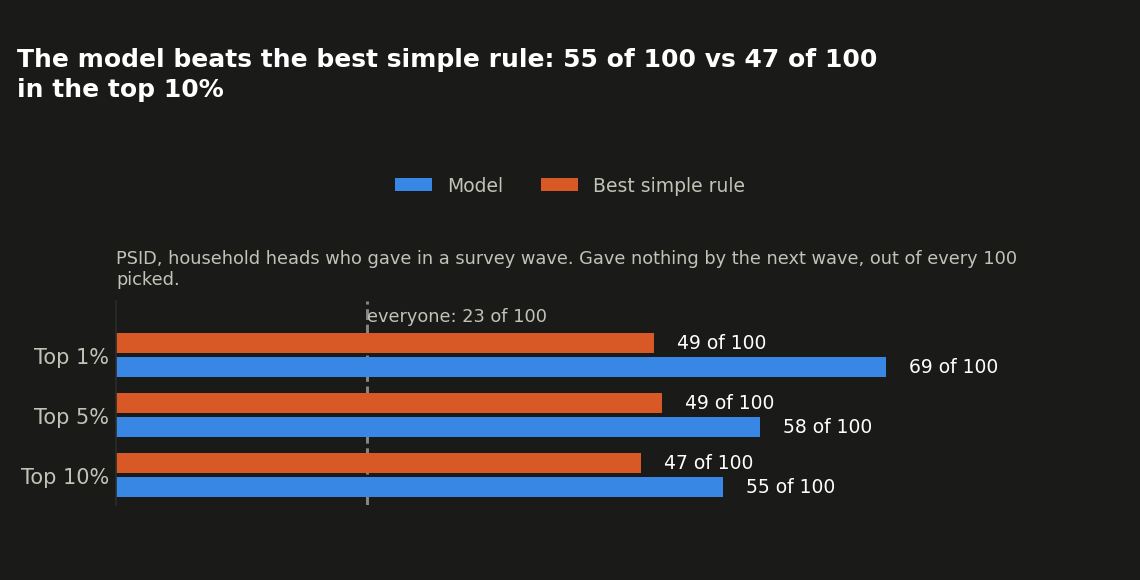
Beats the rule here. On a file where lapsing is the exception, not the norm, the model's list of likely lapsers is clearly better than ranking by this wave's giving.
The retention read.
Flipped the same way as on the other files: about 77 out of every 100 households gave again. Of the 10% the model ranks least likely to lapse, 95 out of every 100 gave again, against 94 for the best rule inverted (households with the longest giving runs in three test waves, the biggest givers in 2015). At the top 5% it is 94 against 95, and at the top 1% 93 against 98.
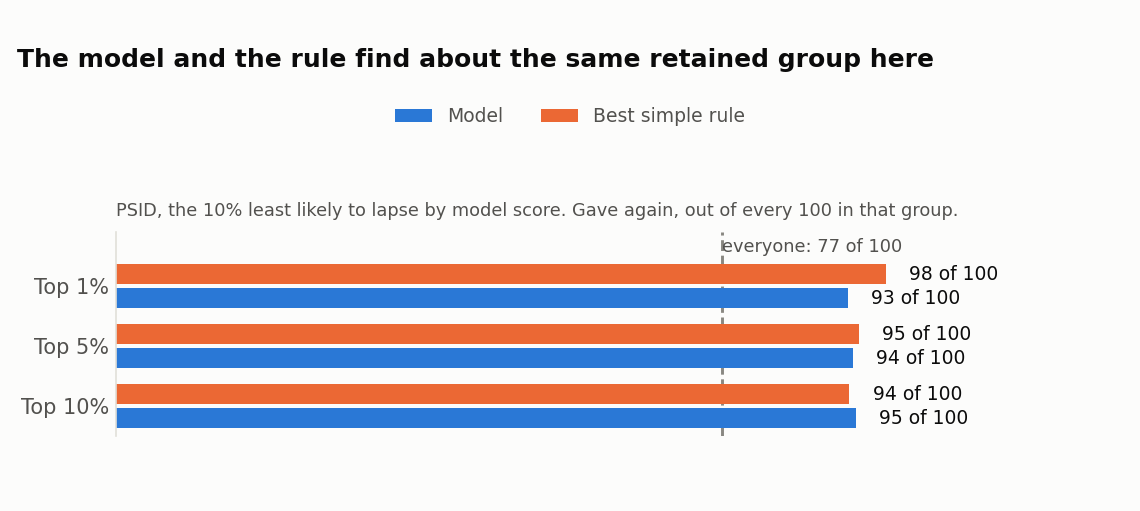
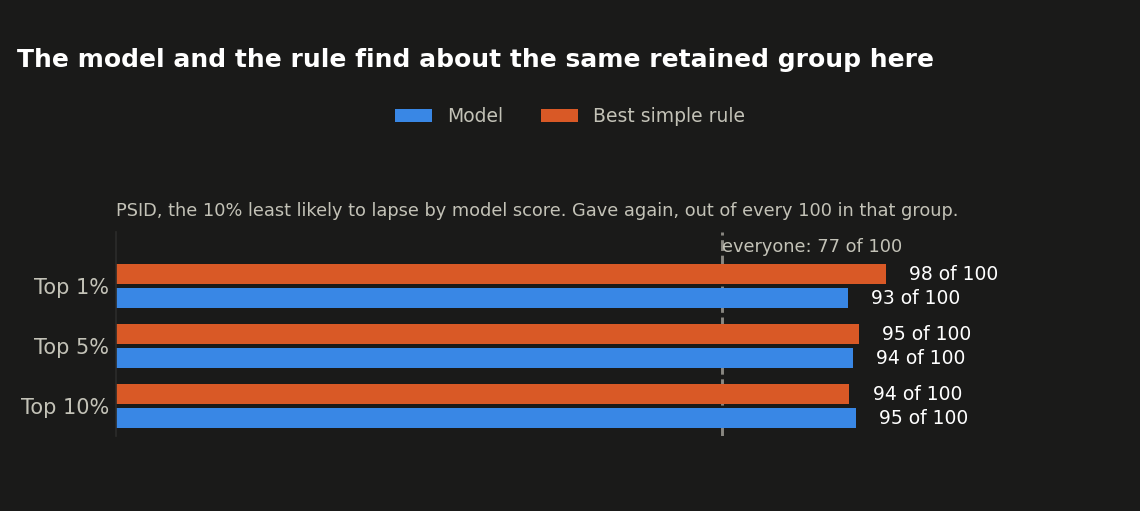
About the same as the rule for this retention read. When most households already keep giving, both find a group that almost all gives again; on a file shaped like this, the lapse list above is the more useful one.
Adding the giving trend between waves as its own feature made no real difference to either read (top 10% lapse hit rate: 54 out of 100 with it, 55 without).
Only aggregates are shown here: no household IDs, no single-household examples. PSID data are not redistributed with this project; to rerun these numbers, download your own extract from the PSID Data Center.
Panel Study of Income Dynamics, public use dataset. Produced and distributed by the Survey Research Center, Institute for Social Research, University of Michigan, Ann Arbor, MI.
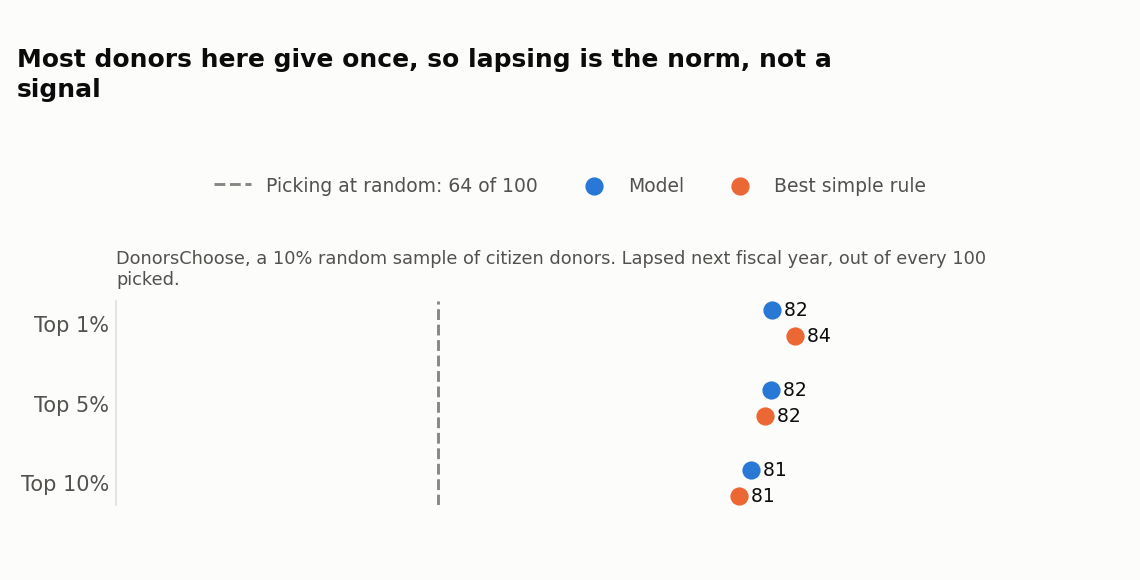
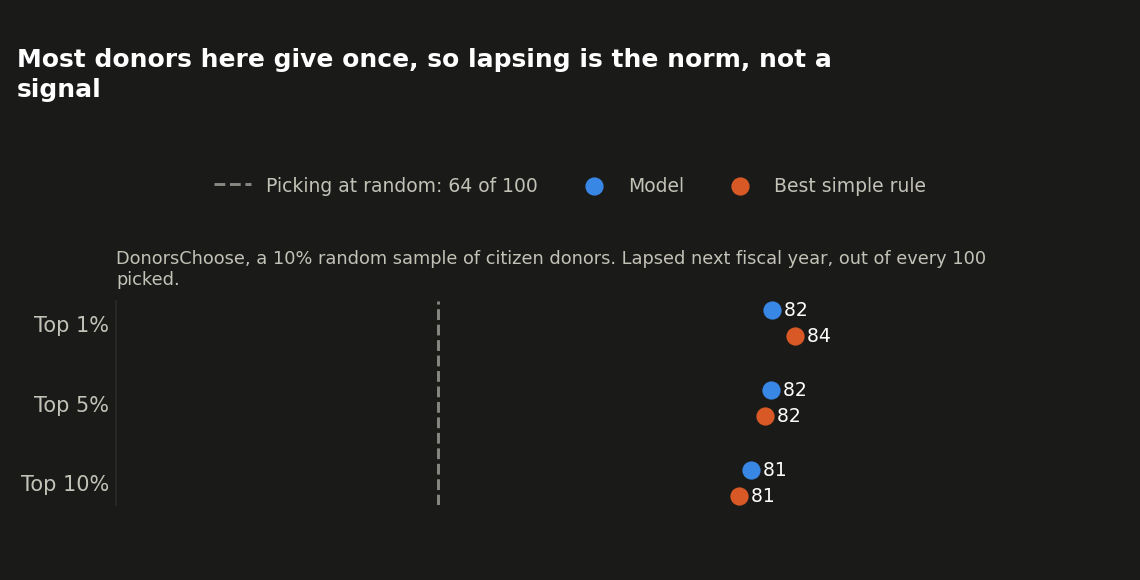
DonorsChoose Open Data (ICPSR 37898, doi:10.3886/ICPSR37898.v1) is mostly one-time donors, whose lapse is close to certain and tells a retention program nothing. So the lapse question is asked only of donors with at least two years of giving, the donors a retention program can act on: from a random 10% sample of individual ("citizen") donors, between 8,076 and 12,108 per test year (fiscal years 2015-2018 tested in turn, training on every earlier year each time). About 64 out of every 100 of them gave nothing in the following fiscal year.
Of the model's top 10% of picks, 81 out of every 100 lapsed. The best simple rule found 81 out of every 100. About the same as the rule here. The two are level at the top 1% too (82 vs 84).
The reverse list: who keeps giving.
Flip the question the same way as on KDD98: take the donors the model is most confident will not lapse (the bottom decile by lapse score). At the top 10% of that ranking, 75 out of every 100 gave again, against 68 out of every 100 for the same rule inverted. At the top 1%, 93 out of 100 against 84 out of 100 for the rule. Picking at random finds about 36 out of every 100 at any size.
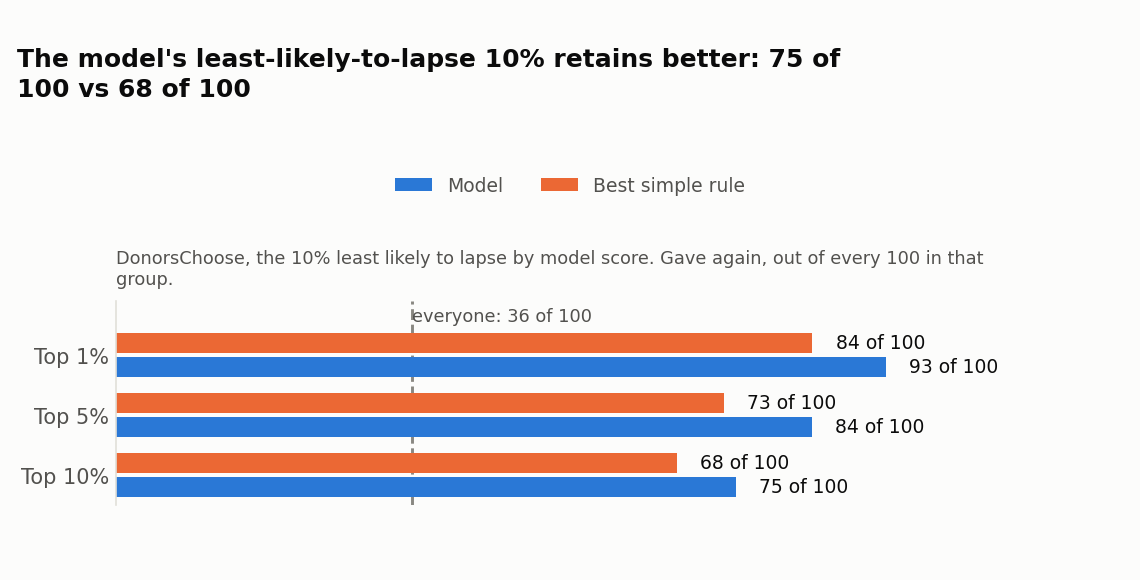
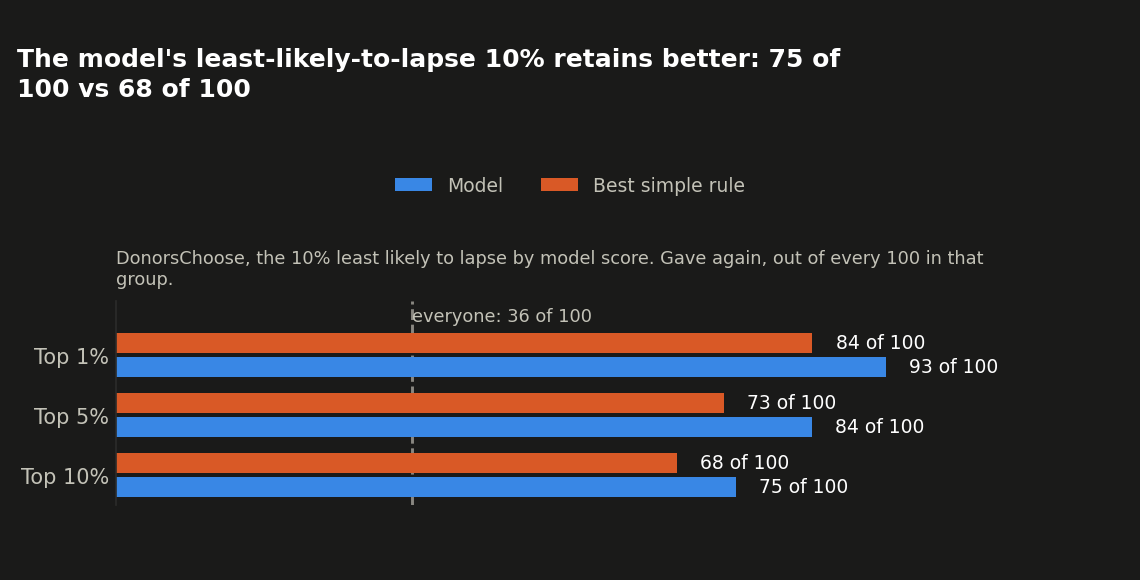
Beats the rule here, in every test year. Even among multi-year donors more than half lapse on this file, so the list of who keeps giving is the more useful one. Aggregates only; no donor-level figures are shown here.
Adding this year's giving trend vs. last year's as its own feature made no real difference to either read (top 10% lapse hit rate: 81 out of 100 with it, 81 without).
Featured on a real donor file: KDD Cup 1998. We pretended it was 1 June 1997, the date of that program's own held-out mailing, and checked who gave nothing to it.
Almost everyone in this file was already about to lapse: about 95 out of every 100 donors gave nothing to the next mailing, whether you pick with a model or not. Of our top 10% of picks, 96 out of every 100 lapsed. The best of the simple rules we compare against here, years since the donor's last gift, found 97 out of every 100. Picking at random also finds about 95 out of every 100.
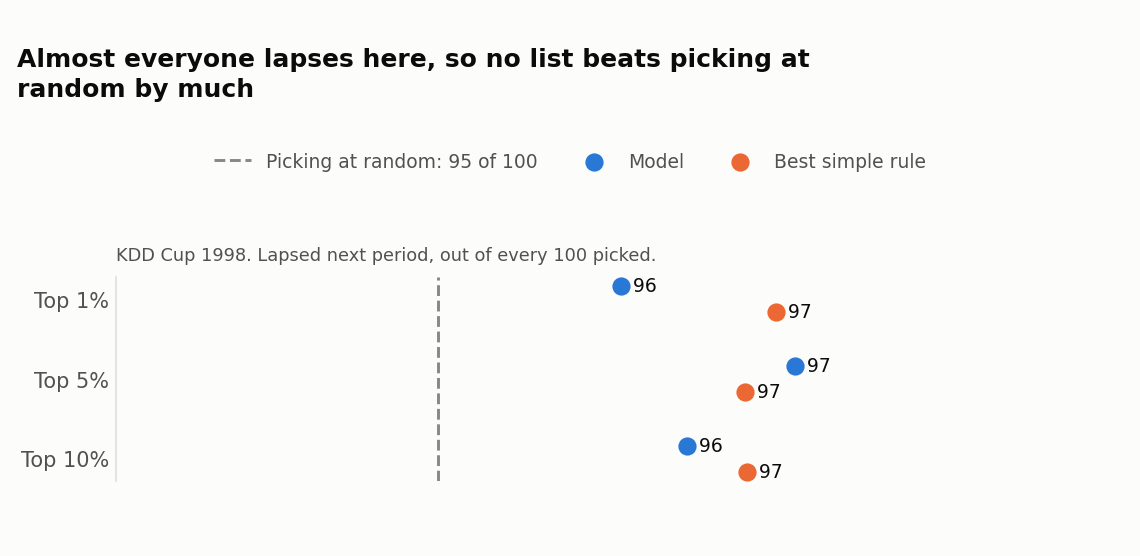
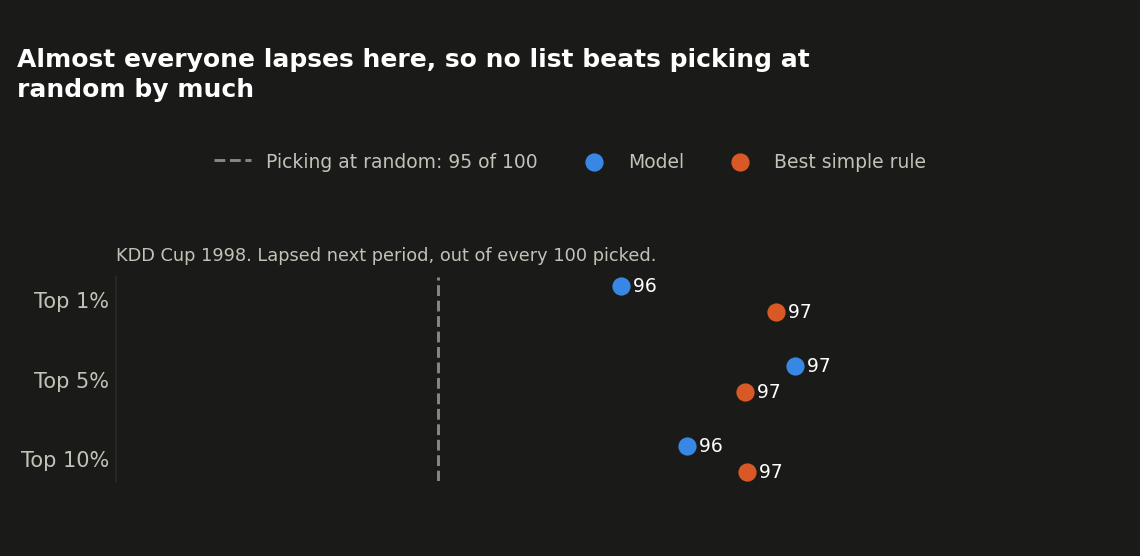
About the same as random picks. When almost every donor is a lapse risk, telling them apart barely matters; do not expect a lapse model to sharpen your list much on a file shaped like this one.
The useful list here is the opposite one.
On a file this lopsided, the question worth asking is not "who is about to lapse" (nearly everyone), it is "who is the model most confident will not lapse". Take the donors the model ranks least likely to lapse: at the top 5% of that ranking, 8 out of every 100 gave again, against 6 out of every 100 for the same rule inverted (donors with the fewest years since their last gift, i.e. the ones the rule itself would call safest). At the top 10% the model is also ahead (6.5 vs 5.6); at the top 1% the two are too close to call (9 vs 9). Picking at random finds about 5 out of every 100 at any size.
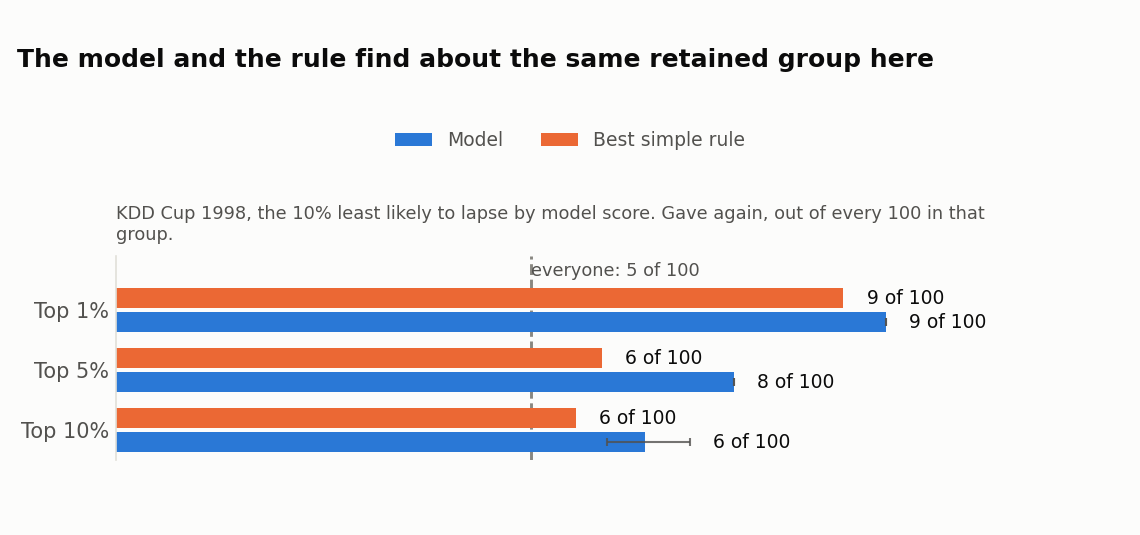
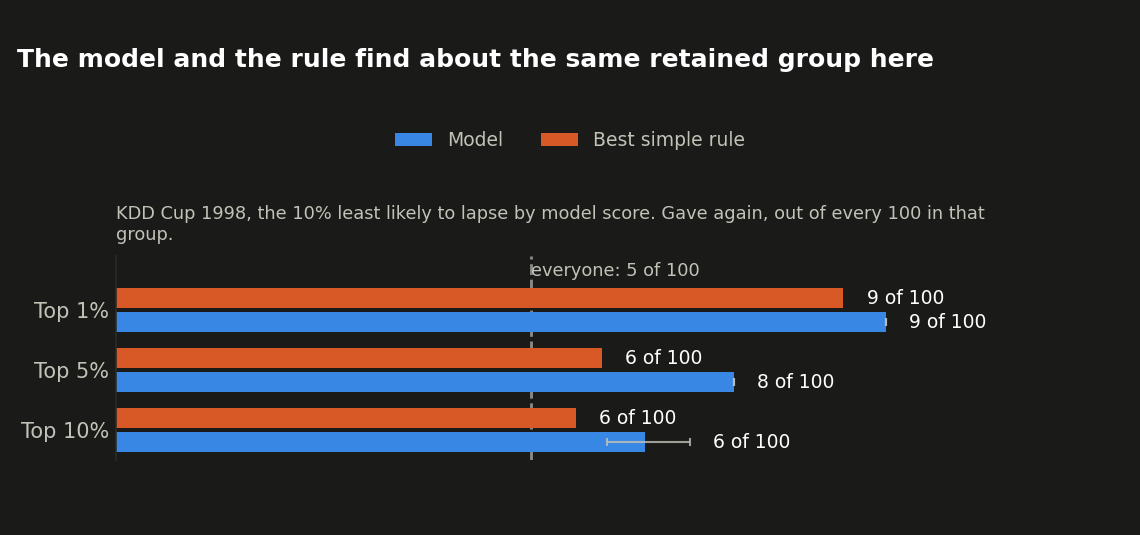
Slightly ahead of the rule for this retention read, most clearly at the top 5%; treat the margin as small. On a file where nearly everyone lapses, use the model this way, as a retention list, not as a lapse list.
On our sample (synthetic) donor panel, which only checks that the code runs, the simple rule "years since the donor's last gift" is ahead of the model at every pick size.
What this means for your file
- On a list of 10,000 households like PSID's, the model's first 1,000 names include about 550 who stop giving; ranking by the smallest giving first finds about 470.
- On a file where most donors lapse, like DonorsChoose, flip the list: of the 1,000 donors the model ranks least likely to lapse, about 750 give again, against about 680 for the rule.
- Your file is not one of these. Check which way your own base rate leans before you pick the lapse list or the retention list.
Try it on your own donors
import numpy as np
from philanthropy.models import LapsePredictor

# Replace with your own donor features and whether each multi-year donor gave
# nothing the following year (1) or kept giving (0); random arrays here only
# show the API runs.
rng = np.random.default_rng(0)
X_train, lapsed_train = rng.random((400, 4)), rng.integers(0, 2, 400)
X_new = rng.random((100, 4))

model = LapsePredictor(random_state=0).fit(X_train, lapsed_train)
risk = model.predict_lapse_score(X_new)
call_first = np.argsort(-risk)[:10]  # likeliest to lapse
keep_list = np.argsort(risk)[:10]    # likeliest to keep giving
How we tested
Real files: KDD Cup 1998, where lapsing is close to universal (95 out of 100), DonorsChoose Open Data, where most multi-year donors still lapse (64 out of 100), and the PSID household survey, where it is a minority outcome (about 23 out of 100) and the model beats the rule. Results on your own file will differ from all four.
Numbers for analysts
On this file the model looks at 3 things about each donor.
| What it knows | What that means |
|---|---|
| Giving history | how much and how often they have given in total |
| Recency | how recently they gave |
This file has no engagement records, so it is not used here. Wealth & demographics and mailing history are in this file, but this model is not given them here.
These matter most:
| What raises or lowers the score | |
|---|---|
| number of gifts | ● depends |
| lifetime giving | ▲ raises the score |
| this year's gift | ● depends |
For analysts
Columns: total, n, recent
| Column | Importance | Direction |
|---|---|---|
n |
0.072 | mixed |
total |
0.022 | + |
recent |
0.003 | mixed |
Method: permutation importance (roc_auc), partial-dependence sign for direction ("mixed" if it changes sign). Split: walk-forward across KDD98 promotion periods (train < period N-1, val=N-1, test=N). Git SHA: d857e8aac5ff4cdbb8c91450cec7583480c1d7af.
Results on your own file will differ.
On this file the model looks at 11 things about each donor.
| What it knows | What that means |
|---|---|
| Giving history | how much and how often they have given in total |
| Recency | how recently they gave |
| Year-over-year change | whether this year's giving is up or down from last year |
This file has no engagement, wealth & demographics, and mailing history records, so they are not used here.
These matter most:
| What raises or lowers the score | |
|---|---|
| number of gifts this year | ▼ lowers the score |
| months since last gift | ▲ raises the score |
| giving this year (this wave on PSID) | ▼ lowers the score |
| giving the year before (the wave before on PSID) | ▼ lowers the score |
| consecutive years (or waves) given | ▼ lowers the score |
For analysts
Columns: period_total, period_total_prior1, period_total_prior2, period_trend, largest_gift, consecutive_periods_given, gave_prior1, gave_prior2, periods_since_first_gift, gift_count, months_since_last_gift
| Column | Importance | Direction |
|---|---|---|
gift_count |
0.022 | - |
months_since_last_gift |
0.022 | + |
period_total |
0.021 | - |
period_total_prior1 |
0.002 | - |
consecutive_periods_given |
0.001 | - |
Method: permutation importance (roc_auc), partial-dependence sign for direction ("mixed" if it changes sign). Split: walk-forward (subsample=0.1, seed=42, last fiscal-year fold). Git SHA: d857e8aac5ff4cdbb8c91450cec7583480c1d7af.
Results on your own file will differ.
On this file the model looks at 30 things about each household.
| What it knows | What that means |
|---|---|
| Giving history | how much and how often they have given in total |
| Recency | how recently they gave |
| Year-over-year change | whether this year's giving is up or down from last year |
| Engagement | events, volunteering and other non-gift contact |
| Wealth & demographics | self-reported household income and wealth (survey answers, not a wealth screen) |
This file has no mailing history records, so it is not used here.
These matter most:
| What raises or lowers the score | |
|---|---|
| giving this year (this wave on PSID) | ● depends |
| giving the year before (the wave before on PSID) | ● depends |
| giving two years before (two waves before on PSID) | ● depends |
| household wealth, counting home equity | ● depends |
| consecutive years (or waves) given | ▼ lowers the score |
For analysts
Columns: period_total, period_total_prior1, period_total_prior2, period_trend, largest_gift, consecutive_periods_given, gave_prior1, gave_prior2, periods_since_first_gift, itemized_charitable_contrib_amount, family_income, wealth1, wealth2, head_volunteer_hours_annual, spouse_volunteer_hours_annual, household_volunteer_hours_regular, head_volunteer_hours_typical_week, spouse_volunteer_hours_typical_week, giving_checkpoint_other_2001, giving_combo, giving_community, giving_cultural, giving_education, giving_environment, giving_health, giving_international, giving_needy, giving_other, giving_religious, giving_youth
| Column | Importance | Direction |
|---|---|---|
period_total |
0.038 | mixed |
period_total_prior1 |
0.022 | mixed |
period_total_prior2 |
0.014 | mixed |
wealth2 |
0.010 | mixed |
consecutive_periods_given |
0.008 | - |
Method: permutation importance (roc_auc), partial-dependence sign for direction ("mixed" if it changes sign). Split: walk-forward (seed=42, last wave fold). Git SHA: d857e8aac5ff4cdbb8c91450cec7583480c1d7af.
Results on your own file will differ.