Response (will they give again?)
Who is most likely to give again next year?
Use the model. It beats the simple rule on two organisations' real donor files. On one charity's mailing it wins on the held-out cup98VAL half and is ahead for your top picks (top 1% and 5%) on the KDD Cup 1998 half; those two halves count as one organisation. On a second charity's letter, the Karlan and List experiment, it wins at every list length checked.
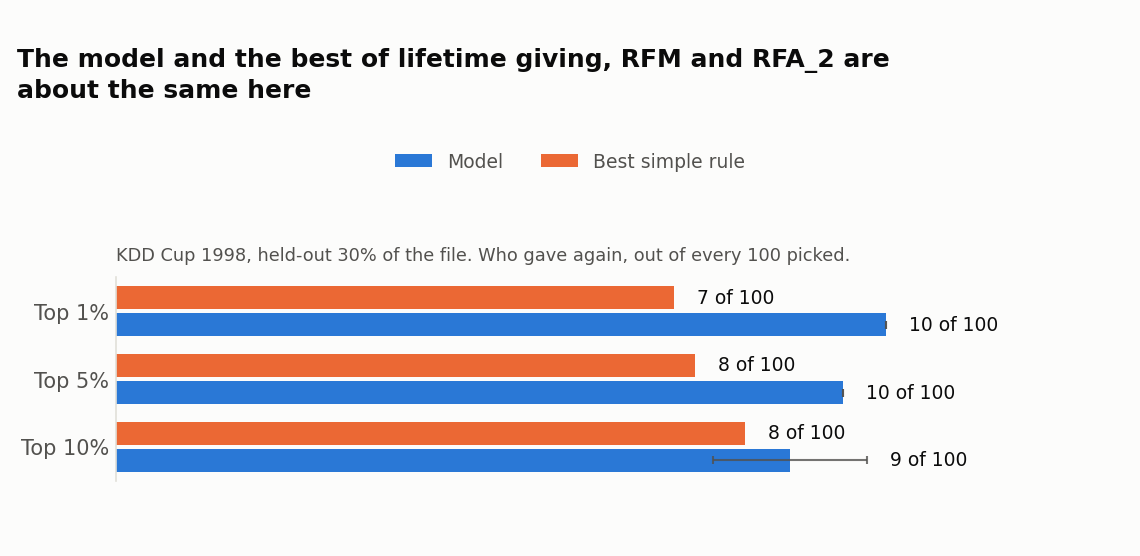
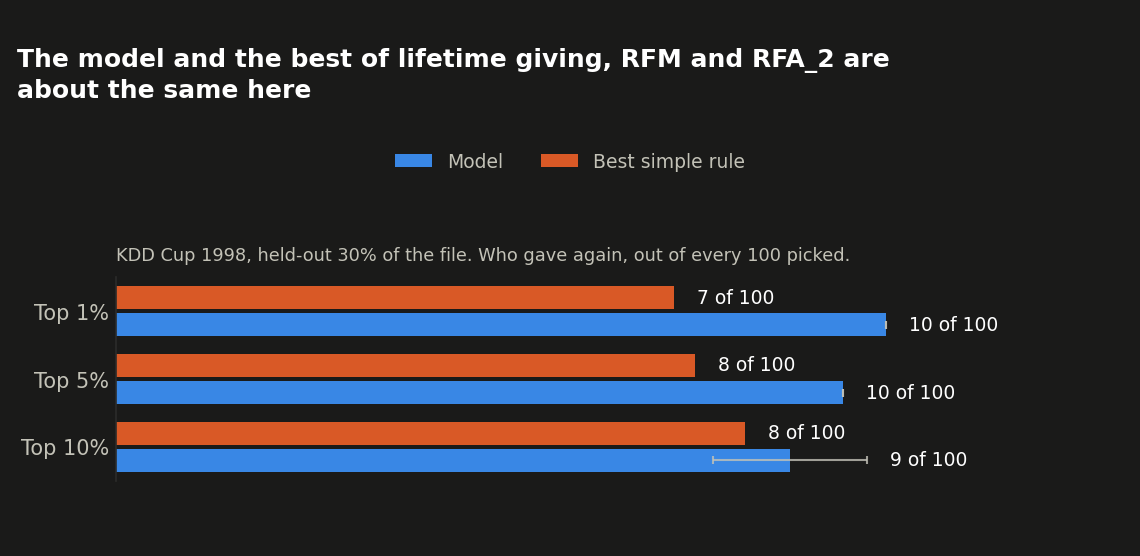
We pretended it was 1 June 1997 and checked who gave to that program's next mailing. Only about 5 out of every 100 donors did, so random picks find about 5 in 100. The comparison rule is the best of lifetime giving, an RFM cell score, and the file's own RFA_2 segment (how often the donor gave recently, then their last gift).
On a held-out 30% of the file, the model's top 1% found 10 in 100 and its top 5% found 10 in 100, against 7 and 8 in 100 for the best rule. At the top 10% it was about the same as the rule (9 in 100 against 8).
Checked again on a file the model never saw at all. cup98VAL, a second, entirely
separate file this program released (96,367 more donors, its answer key withheld until
after the original competition and never touched during fitting), gives the same shape: the
model's top 1% found 12 in 100 and its top 10% found 9 in 100, against 9 and 7 in 100 for the
best rule.
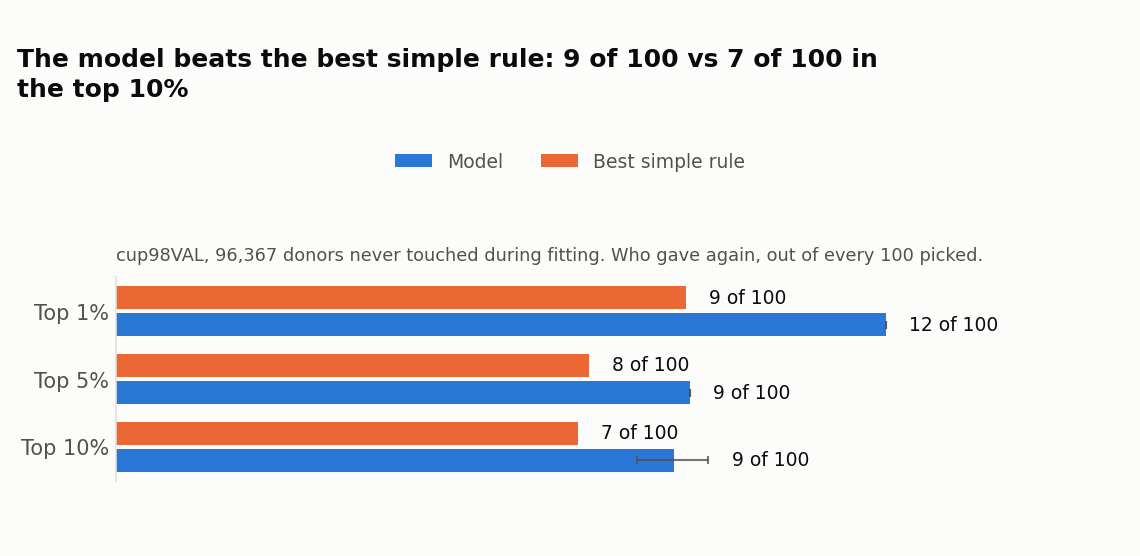
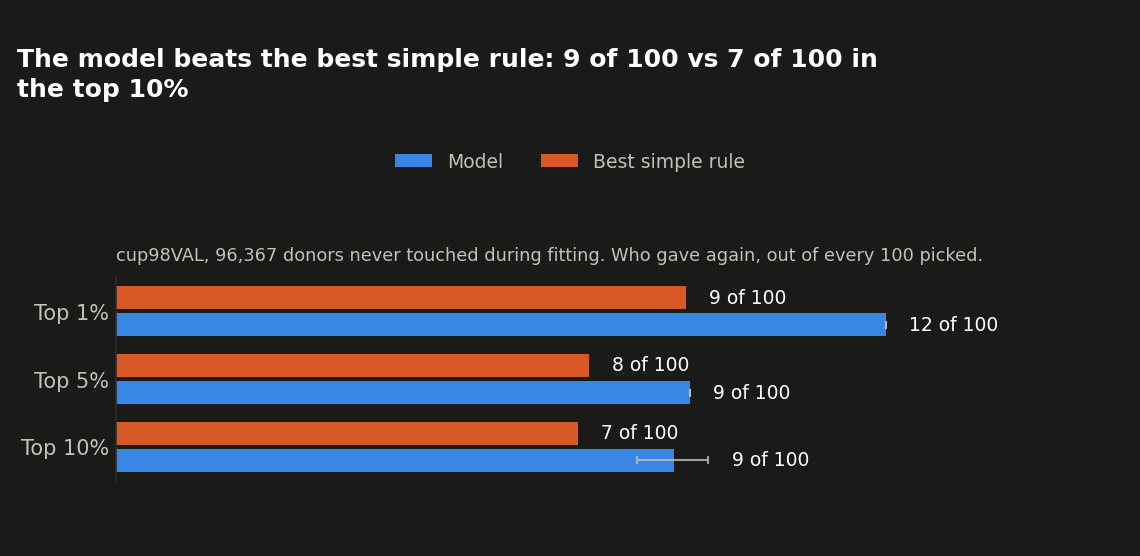
So on this real file the model beats the rule for your top picks, on two separate donor files from the same program. Results on your own file will differ.
About 50,000 past donors to one US charity got the same fundraising letter in 2005, and about 2 in 100 gave. The model saw only what the charity knew before mailing: number of past gifts, largest past gift, months since the last gift, years as a donor, and a few facts from the donor record. The comparison rule is the best of most recent first, largest past gift first, most gifts first, and an RFM cell score built from those three.
On a held-out 30% of the donors, the model's top 10% found 8.0 in 100 who gave, against 5.5 in 100 for the best rule (most gifts first). At the top 1% it found 23 in 100 against 13. Picking at random finds about 2 in 100.
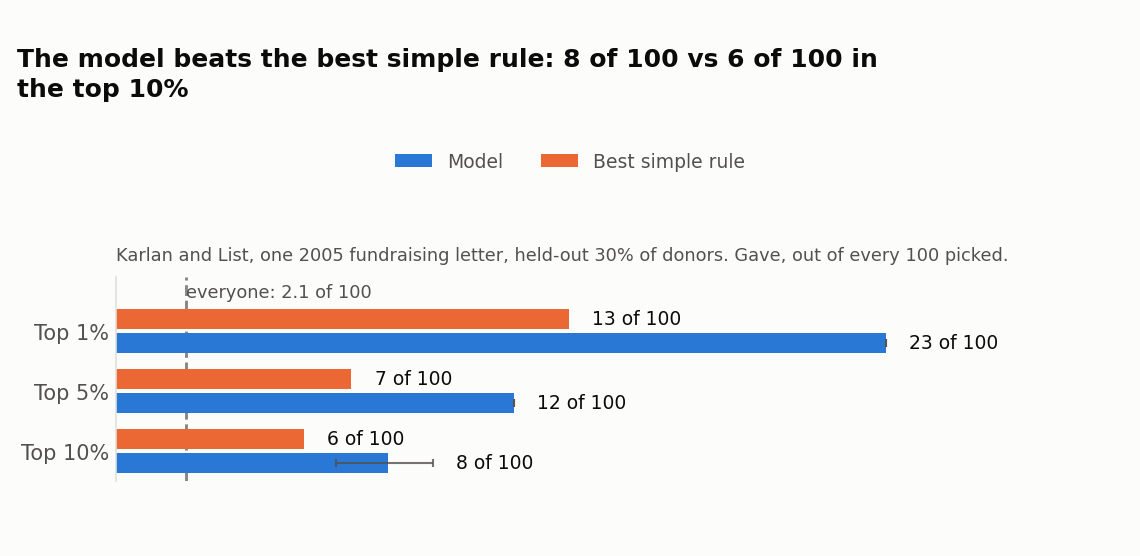
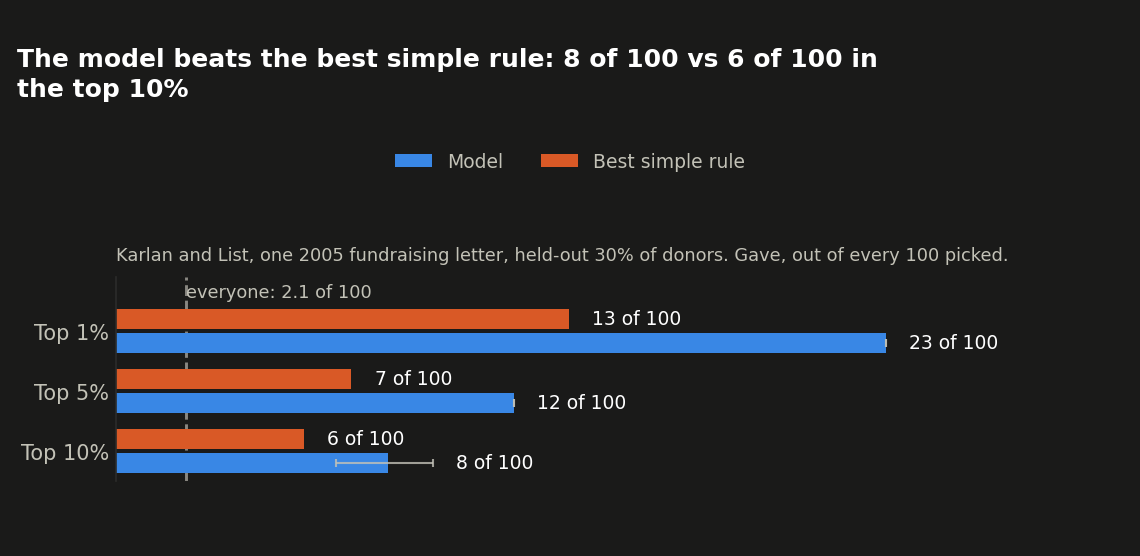
This is a different charity from the KDD Cup 1998 tab, so it is a second, independent check. Results on your own file will differ.
Does a matching-grant offer move some donors more than others?
The Karlan and List letter came in versions: two in three donors, picked at random, were told a
matching grant would multiply their gift. Because the offer was random, the file can test an
uplift model (UpliftTLearner), which ranks donors by how much the offer raises their chance of
giving, not by how likely they are to give at all.
Across all held-out donors, the offer raised giving by about 0.4 in 100. Among the 30% the uplift model ranked highest, it raised giving by about 0.6 in 100, against 0.5 for the best of two simple rules (most recent donors first). The range on that gap runs from the model about 1 in 100 behind to about 1 in 100 ahead, so this is about the same as the rule. Ranking donors by who the offer moves most does not yet beat ranking by recency on this file.
Aggregates only; no donor-level figures are shown here.
Karlan, D. and List, J. A. (2007), "Does Price Matter in Charitable Giving? Evidence from a Large-Scale Natural Field Experiment", American Economic Review 97(5): 1774-1793. Data from openICPSR 113224 (doi:10.3886/E113224V1), CC BY 4.0, copyright American Economic Association 2007.
We pretended it was 30 June 2022: the model only saw gifts up to that date, then we checked which donors actually gave again in fiscal year 2023 (1 July 2022 to 30 June 2023).
Of our top 5% of picks, 80 out of every 100 gave again. The best simple rule we compare against here (ranking by lifetime giving, or an RFM cell score combining recency, frequency and monetary value, whichever does better on each draw) found 84 out of every 100. Picking at random finds about 44 out of every 100.
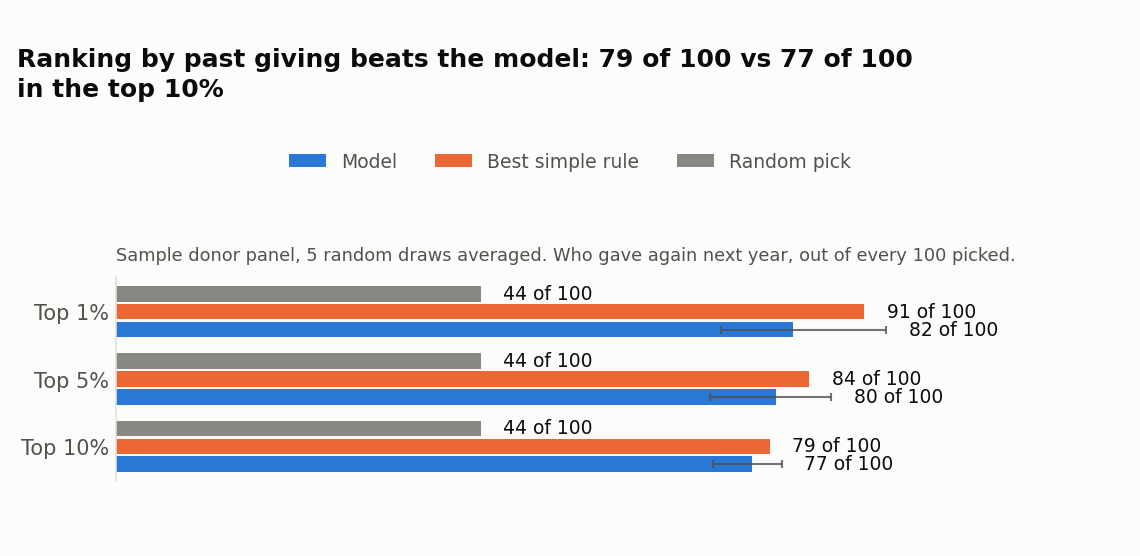
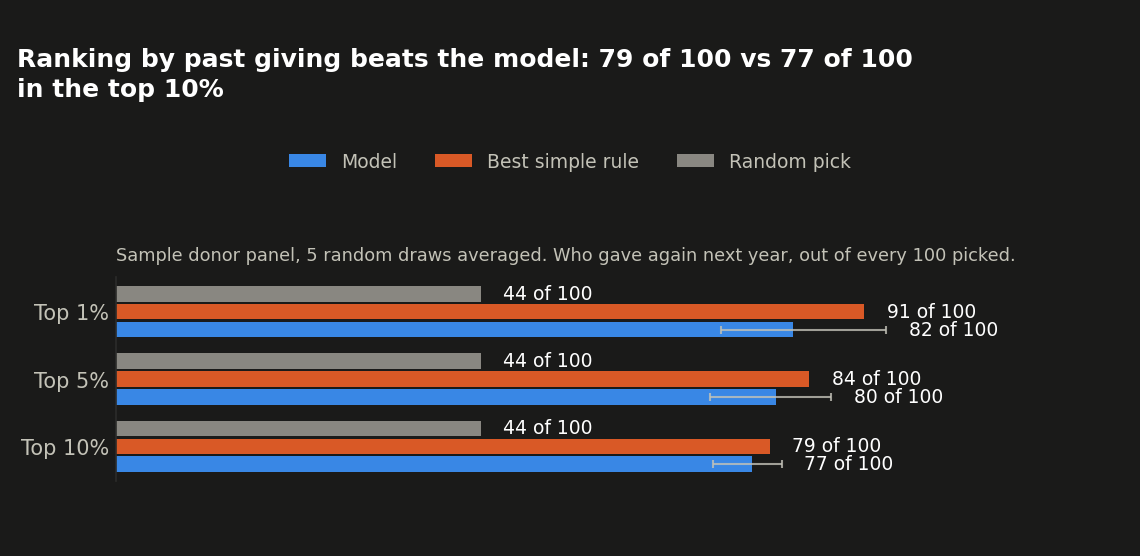
Code check only: sample data is not counted in the verdict. Ranking donors by their own giving history does at least as well as the model at every pick size checked. Our sample data is built so that giving again follows past giving almost exactly, which is why no model can beat ranking by past giving on it: this tab proves the pipeline runs end to end, it is not a test the model can pass. See the real-file tab above for a test that actually distinguishes the model from the rule.
What this means for your file
- On a list of 10,000 donors like the Karlan and List file, the model's first 1,000 names include about 80 who give; the best simple rule's first 1,000 include about 55.
- On the KDD Cup 1998 mailing the model's edge is in its very top picks, the first 100 to 500 names of a 10,000-donor list; further down it is about the same as the rule.
- Your file is not one of these. Check the model against the rule your shop already uses before you trust its list.
Try it on your own donors
import numpy as np
from philanthropy.models import DonorPropensityModel

# Replace with your own donor features and whether each donor gave to the
# last appeal (1) or not (0); random arrays here only show the API runs.
rng = np.random.default_rng(0)
X_train, gave_train = rng.random((400, 4)), rng.integers(0, 2, 400)
X_new = rng.random((100, 4))

model = DonorPropensityModel(random_state=0).fit(X_train, gave_train)
score = model.predict_affinity_score(X_new)
call_first = np.argsort(-score)[:10]  # your top 10% of this list
How we tested
Each tab says what date we pretended it was and what we checked. Results on your own file will differ from all of these.
Not testable on DonorsChoose or PSID. DonorsChoose Open Data has no mailing/appeal log, so a response model has nothing to predict response to; the PSID giving/volunteering extract has the same gap.
Numbers for analysts
On this file the model looks at 4 things about each donor.
| What it knows | What that means |
|---|---|
| Giving history | how much and how often they have given in total |
| Recency | how recently they gave |
This file has no engagement records, so it is not used here. Wealth & demographics and mailing history are in this file, but this model is not given them here.
These matter most:
| What raises or lowers the score | |
|---|---|
| number of gifts | ▲ raises the score |
| months since last gift | ▼ lowers the score |
| lifetime giving | ▼ lowers the score |
| years as a donor | ▼ lowers the score |
For analysts
Columns: recency, frequency, monetary, tenure
| Column | Importance | Direction |
|---|---|---|
frequency |
0.073 | + |
recency |
0.009 | - |
monetary |
0.008 | - |
tenure |
0.005 | - |
Method: permutation importance (roc_auc), partial-dependence sign for direction ("mixed" if it changes sign). Split: 55/15/30 stratified (train/validation/test). Git SHA: d857e8aac5ff4cdbb8c91450cec7583480c1d7af.
Results on your own file will differ.
On this file the model looks at 4 things about each donor.
| What it knows | What that means |
|---|---|
| Giving history | how much and how often they have given in total |
| Recency | how recently they gave |
This file has no engagement records, so it is not used here. Wealth & demographics and mailing history are in this file, but this model is not given them here.
These matter most:
| What raises or lowers the score | |
|---|---|
| number of gifts | ▲ raises the score |
| months since last gift | ▼ lowers the score |
| lifetime giving | ▼ lowers the score |
| years as a donor | ▼ lowers the score |
For analysts
Columns: recency, frequency, monetary, tenure
| Column | Importance | Direction |
|---|---|---|
frequency |
0.073 | + |
recency |
0.009 | - |
monetary |
0.008 | - |
tenure |
0.005 | - |
Method: permutation importance (roc_auc), partial-dependence sign for direction ("mixed" if it changes sign). Split: 55/15/30 stratified (train/validation/test). Git SHA: d857e8aac5ff4cdbb8c91450cec7583480c1d7af.
Same model and features as the KDD Cup 1998 tab; cup98VAL supplies new test donors on the same columns, not new columns.
Results on your own file will differ.
On this file the model looks at 8 things about each donor.
| What it knows | What that means |
|---|---|
| Giving history | how much and how often they have given in total |
| Recency | how recently they gave |
| Wealth & demographics | gender, couple and the 2004 vote where the donor lives (no wealth screen) |
This file has no engagement and mailing history records, so they are not used here.
These matter most:
| What raises or lowers the score | |
|---|---|
| number of past gifts | ▲ raises the score |
| months since last gift | ▼ lowers the score |
| largest past gift | ● depends |
| years as a donor | ▼ lowers the score |
| state voted Republican in 2004 | ▲ raises the score |
For analysts
Columns: prior_gifts, highest_previous_amount, months_since_last_gift, years_since_first_gift, female, couple, red_state, red_county
| Column | Importance | Direction |
|---|---|---|
prior_gifts |
0.122 | + |
months_since_last_gift |
0.082 | - |
highest_previous_amount |
0.064 | mixed |
years_since_first_gift |
0.016 | - |
red_state |
0.001 | + |
Method: permutation importance (roc_auc), partial-dependence sign for direction ("mixed" if it changes sign). Split: 55/15/30 stratified (train/validation/test). Git SHA: d857e8aac5ff4cdbb8c91450cec7583480c1d7af.
Results on your own file will differ.
On this file the model looks at 3 things about each donor.
| What it knows | What that means |
|---|---|
| Giving history | how much and how often they have given in total |
| Recency | how recently they gave |
This file has no engagement and mailing history records, so they are not used here. Wealth & demographics is in this file, but this model is not given it here.
These matter most:
| What raises or lowers the score | |
|---|---|
| lifetime giving | ▲ raises the score |
| this year's gift | ▲ raises the score |
Only 2 features had a measurable effect; the rest are in the analyst note below.
What adding information did
| What the model saw | Top 1% | Top 5% | Top 10% |
|---|---|---|---|
| only what the model uses today | 82 of 100 | 80 of 100 | 77 of 100 |
| plus giving streak, time since last gift, last year's gift, biggest gift and tenure | 80 of 100 (between 70 and 87) | 81 of 100 (between 77 and 85) | 77 of 100 (between 75 and 81) |
| the best simple rule (for comparison) | 91 of 100 | 84 of 100 | 79 of 100 |
The extra signals made about the same difference at the top of the list.
For analysts
Columns: total, n, recent
| Column | Importance | Direction |
|---|---|---|
total |
0.173 (range 0.113 to 0.205) | + |
recent |
0.020 (range 0.008 to 0.030) | + |
n |
0.002 (range -0.002 to 0.007) | - |
Method: permutation importance (roc_auc), partial-dependence sign for direction ("mixed" if it changes sign). Split: walk-forward (train on fiscal years < T, test on T). Git SHA: d857e8aac5ff4cdbb8c91450cec7583480c1d7af.
Results on your own file will differ.